TWLO 47-day bearish forecast — Oct 30, 2026
- Bias: Bearish
- Timeframe: 47 days (made Oct 30, 2026, target date Dec 16, 2026)
- Price at analysis: $189.99
- Price target: $181.00
- Expected range: $166.00 – $197.00
- Result: Pending — graded after the close on Dec 16, 2026
Get a free AI analysis of TWLO today
Analysis
TECHNICAL INDICATORS
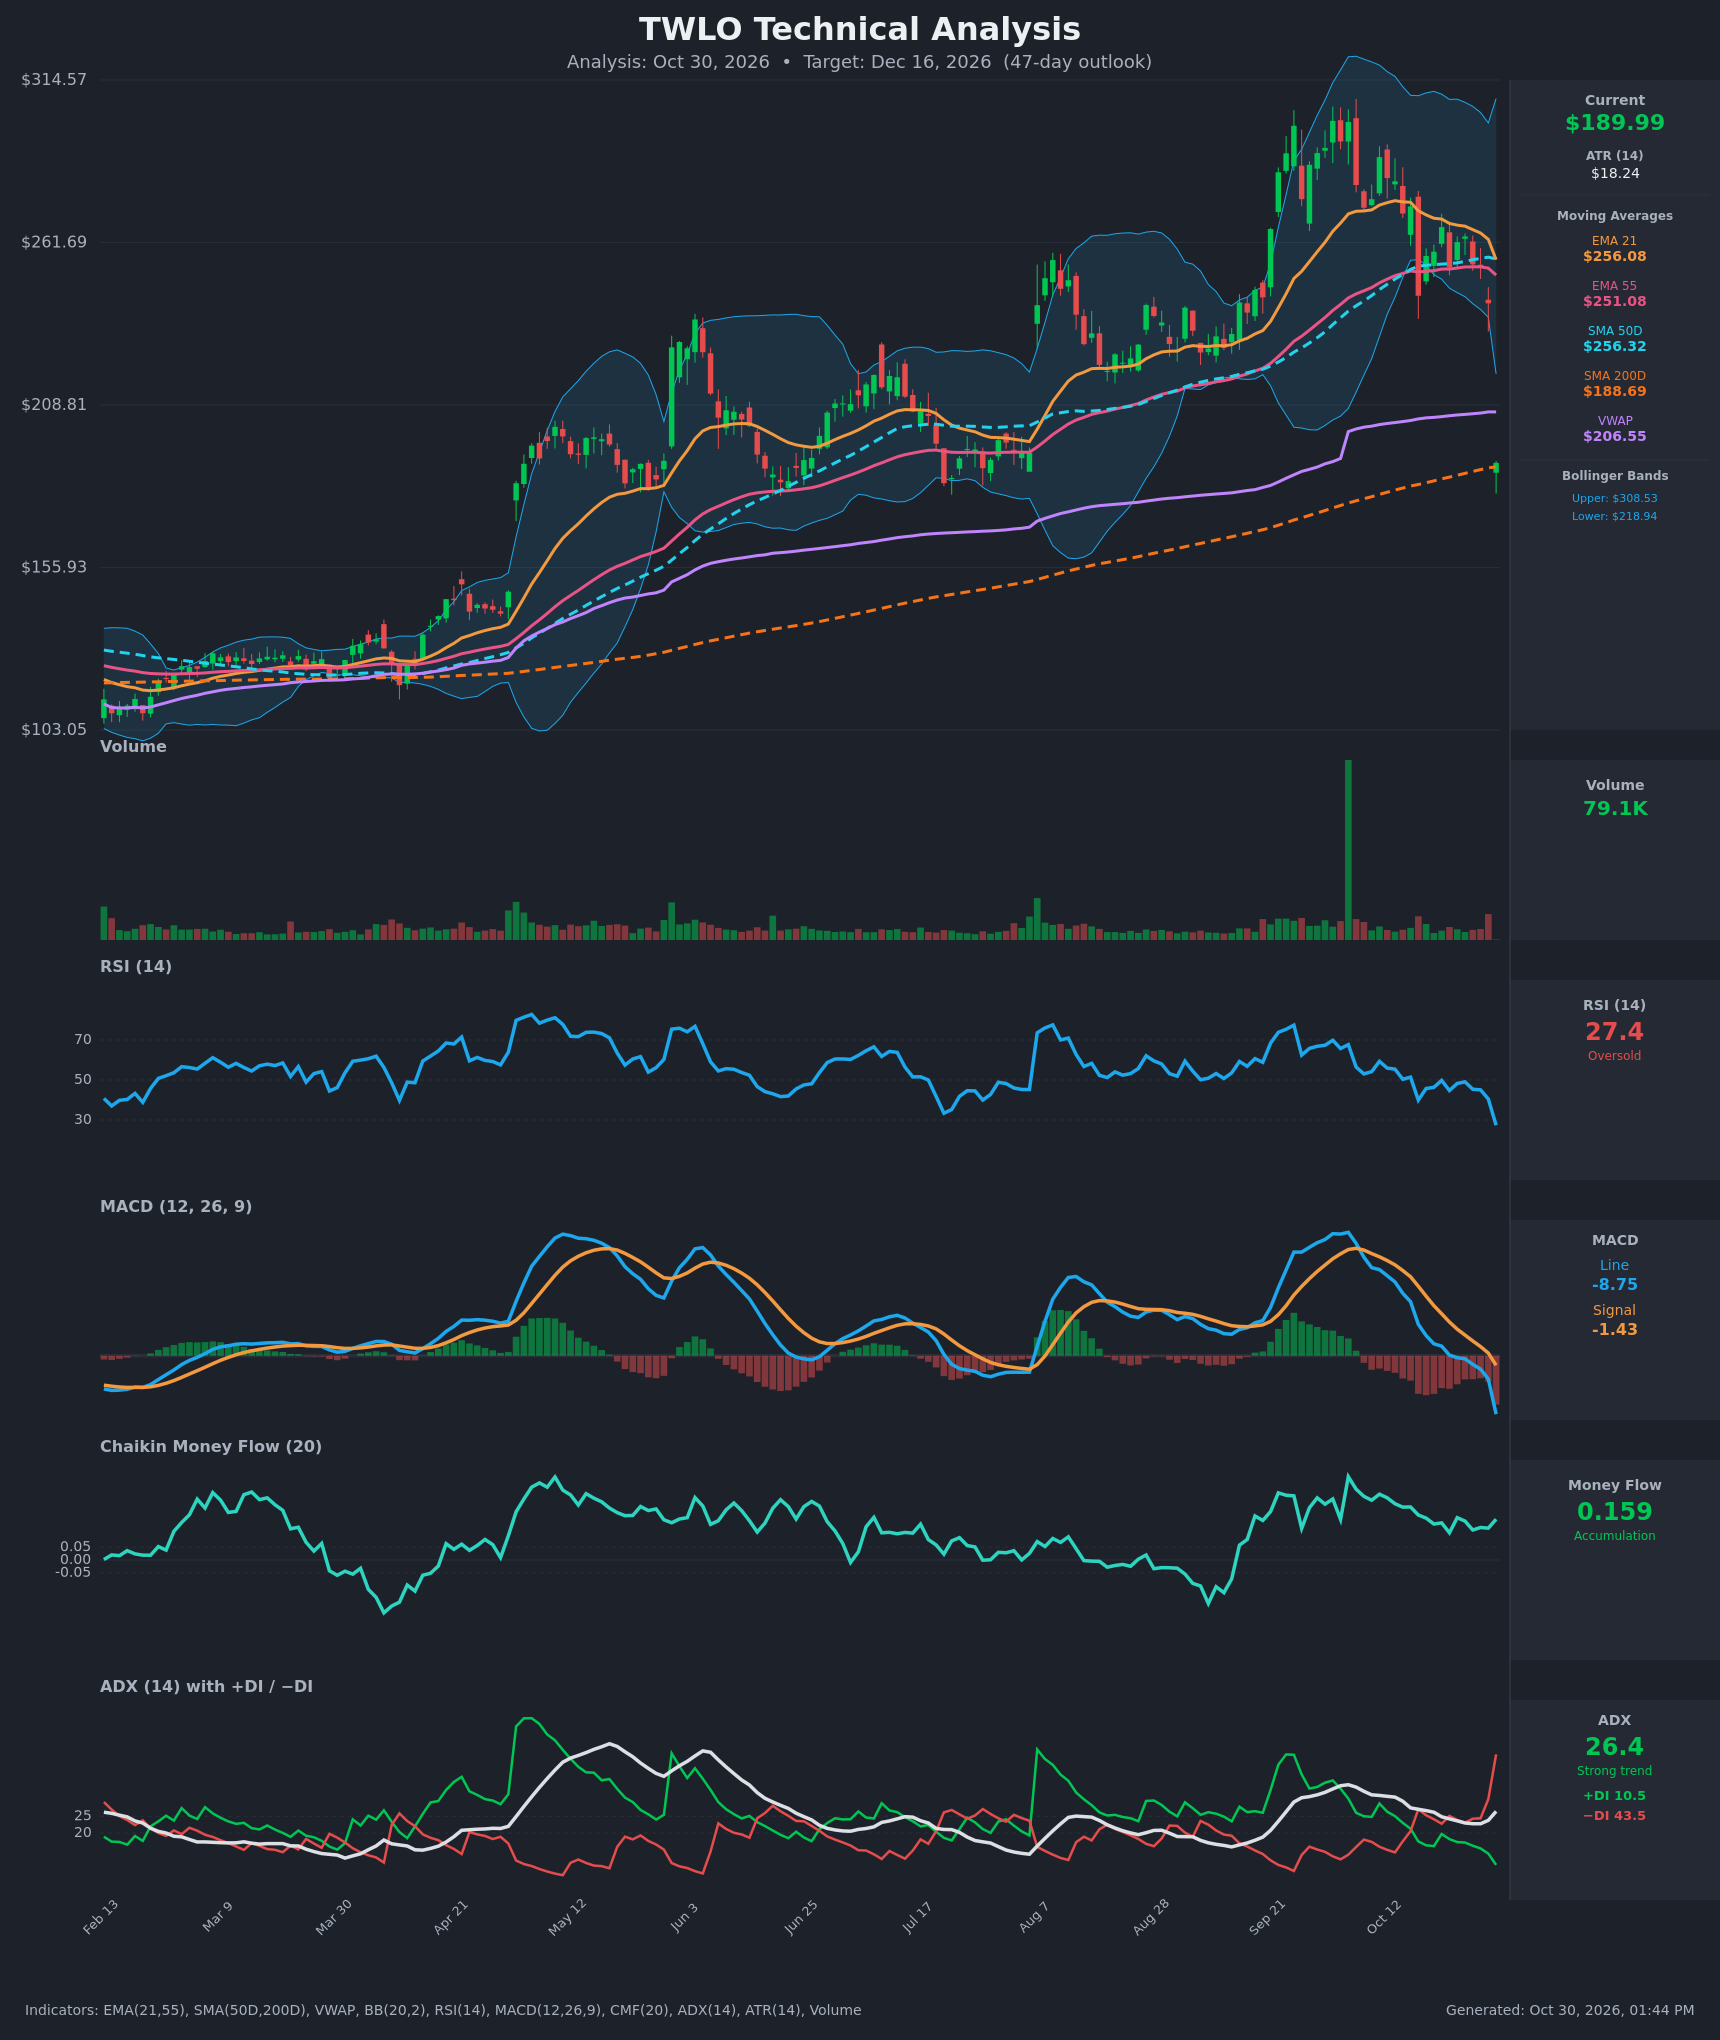
- RSI (14): 27.39, oversold and down from about 40.5 the previous day and 56 on Oct 12. Momentum is sharply negative, but the reading is stretched and a relief bounce is possible. [Bearish]
- 20 EMA (EMA 21): $256.08, and price at $189.99 is about 26% below it. The EMA is rolling over and acting as heavy overhead resistance. EMA21 is only $5 above EMA55 ($251.08), so a bearish cross is close. [Bearish]
- MACD: Line -8.75 is below the signal at -1.43, and the histogram is deeply negative and expanding. The line crossed below signal around Oct 12 and below zero on Oct 23. Momentum is accelerating down. [Bearish]
- Bollinger Bands (20): Price at $189.99 is far below the lower band ($218.94), a roughly $29 breach and a statistical extreme after a ~21% one-day gap. The bands are very wide (upper $308.53), so volatility has expanded. Such extremes often bring a bounce, but a "band walk" lower is also possible. [Bearish]
- CMF (20): 0.159, above +0.05, and it has been positive throughout. It is a lagging 20-bar measure that has not yet absorbed the crash. Accumulation from earlier in the period is still in the reading. [Accumulation]
- ADX (14): 26.4 and rising from 22.8, with −DI at 43.5 far above +DI at 10.5. Bears are firmly in control and the trend is strengthening. [Strong Trend – Bearish]
- Volume: 79.1K on the latest bar, with the crash candle likely still incomplete or thin relative to the earlier spikes. The volume read is not fully confirming, so treat it with caution. A gap of this size normally draws heavy volume. [Inconclusive / Mildly Bearish]
DIVERGENCES & TRENDS
- No bullish RSI divergence yet. RSI and price are both making new lows together.
- MACD has trended down since the Sep/Oct peak (line near +12 on Oct 12 to -8.75). The bearish crossover, zero-line break and widening histogram all confirm weakening momentum.
- ADX has risen from a low of 22.8 to 26.4 while −DI spiked from 24 to 43.5. This is a fresh bearish DI expansion, which supports trend continuation.
- Price fell from $241.90 to $189.99 (about -21%) in one session and went from above to below EMA21, EMA55, SMA50D and VWAP ($206.55) at once. The close sits right on SMA200D ($188.69), the last major long-term support.
- SMA50D ($256.32) remains well above SMA200D, so there is no death cross yet. That could develop over the next several weeks if price stays depressed.
- CMF staying positive is the main bullish offset, but it is lagging.
CHART PATTERNS
- Price formed a rounded top / distribution structure from September into October, with lower highs and a failed retest near $270. This is loosely a bearish double top, and the gap-down through support completed the breakdown. The pattern is not textbook-clean.
- The Oct 14–28 sideways drift below the highs resembled a bearish flag/pennant. The gap-down resolved it lower, consistent with the Bearish Flag/Pennant continuation pattern.
- A measured move from the $290 peak to the neckline near $255 projects roughly $35 lower, which points to the $190–$220 zone. That target is largely already reached, which fits the stall at SMA200D.
- Support is $188.69 (SMA200D), then roughly $170 and $155. Resistance starts at VWAP ($206.55), then the BB lower band ($218.94) and the gap zone near $242.
POTENTIAL SCENARIOS
- Scenario 1: Bearish Post-Gap Drift Below SMA200D — Post-event selling continues and price loses the SMA200D, with −DI dominant and MACD still falling. Rallies fade into the gap and VWAP. Trigger: daily close below $188.69. Target: $170–$175, with an extension toward $160. Invalidation: daily close above $206.55 (VWAP). (50% probability)
- Scenario 2: Bullish Oversold Relief Bounce — RSI below 30 and a deep Bollinger breach attract dip-buyers, with SMA200D support and positive CMF helping. Price retraces part of the gap. Trigger: a strong close above $200 on rising volume. Target: $206–$219 (VWAP, then the lower band). Invalidation: close below $180. (35% probability)
- Scenario 3: Neutral Base Building — Price chops between the SMA200D and VWAP as volatility compresses after the shock. Trigger: several closes between $175 and $205. Target: $185–$195. Invalidation: a decisive close outside $170–$207. (15% probability)
PRICE TARGETS
- Target Price: $181.00 (47 days, Dec 16, 2026)
- Expected Range: $166.00 to $197.00 (width $31, about 16.3% of current price, which fits the 30–60 day guidance of 12–18%)
- Key Levels: Support at $188.69, Resistance at $206.55
OVERALL BIAS
OVERALL BIAS: BEARISH - A ~21% gap-down through every short- and medium-term moving average, a MACD bearish crossover with an expanding negative histogram, and −DI (43.5) far above +DI (10.5) with ADX rising all favor continued downside drift. Oversold RSI and the SMA200D support at $188.69 keep a relief bounce possible, but the weight of evidence favors a break lower.
This is educational analysis and not financial advice.