GD 47-day bullish forecast — Oct 30, 2026
- Bias: Bullish
- Timeframe: 47 days (made Oct 30, 2026, target date Dec 16, 2026)
- Price at analysis: $377.10
- Price target: $386.00
- Expected range: $350.00 – $402.00
- Result: Pending — graded after the close on Dec 16, 2026
Get a free AI analysis of GD today
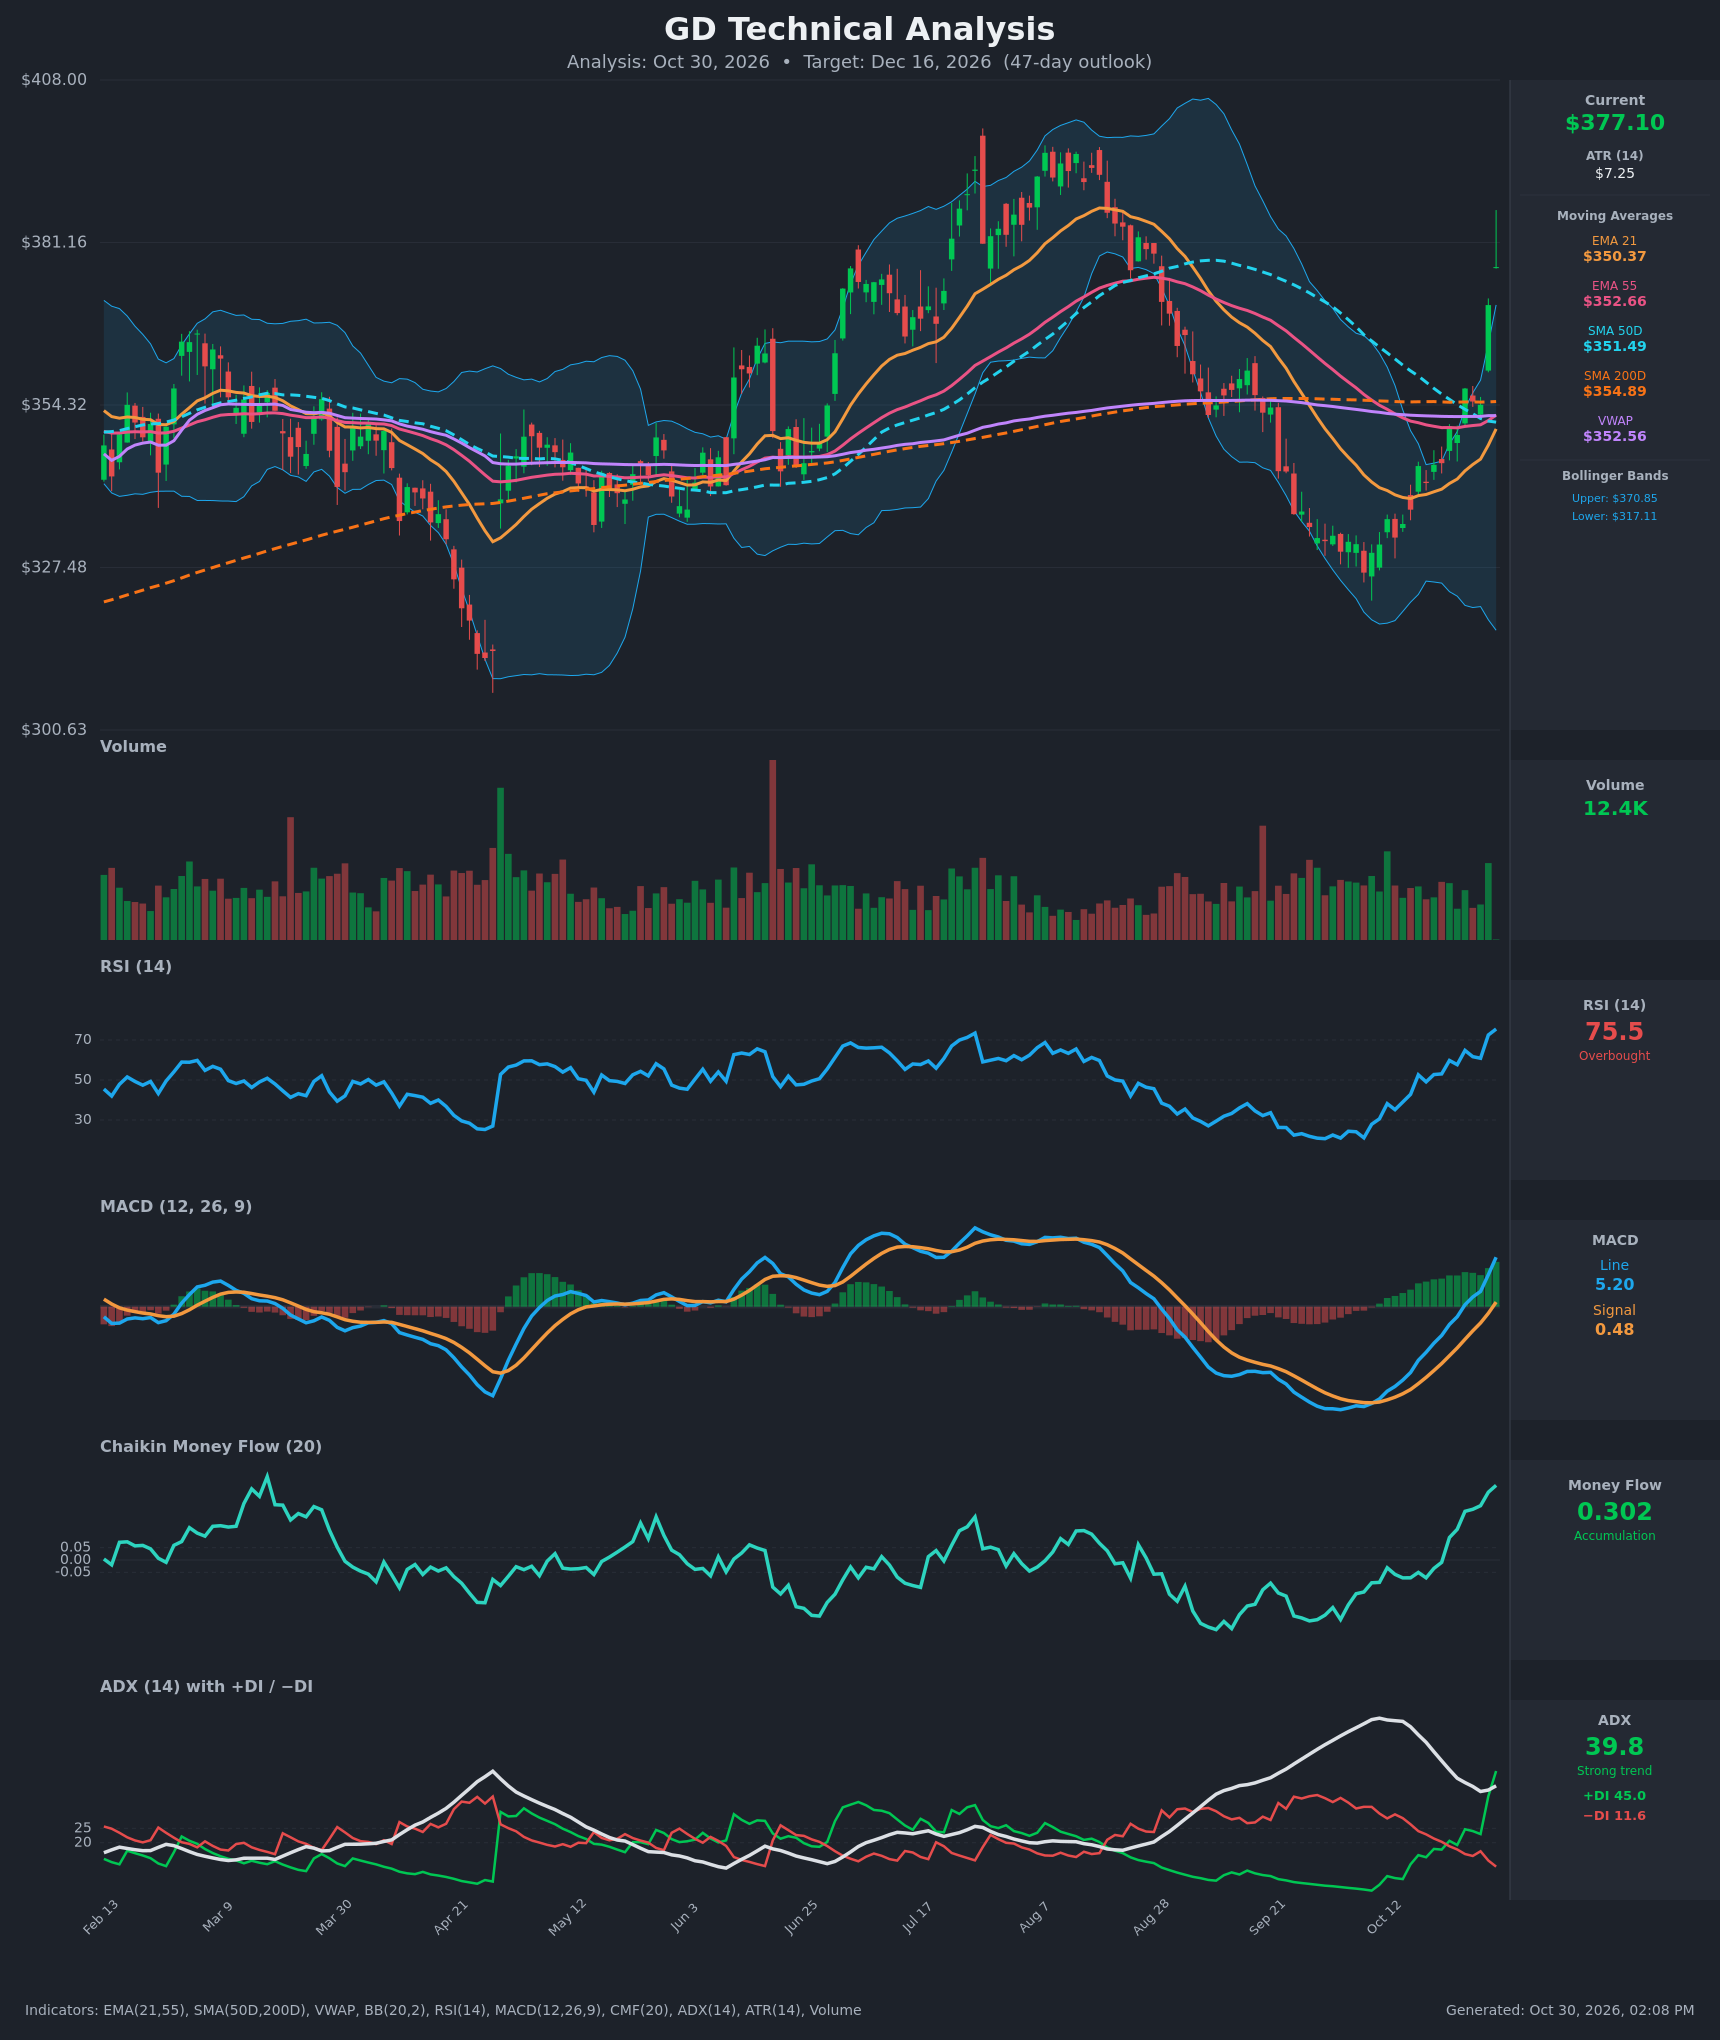
Analysis
TECHNICAL INDICATORS
- RSI (14): 75.49, overbought. It surged from about 38 on Oct 12 to 75.5, with a sharp jump on Oct 29 (60.9 to 72.5). Momentum is strong, but a reading this high raises the odds of a pause or pullback. [Bullish]
- 20 EMA (EMA 21): $350.37, with price at $377.10 about 7.6% above it. EMA21 has turned up and is about to cross EMA55 ($352.66). Price is stretched well above the average, so a mean-reversion pullback toward $350–$355 is possible, but the EMA stack is turning supportive. [Bullish]
- MACD: Line 5.195 vs. signal 0.484. The bullish crossover happened Oct 26 and the histogram is expanding (about +4.7). The line has moved from -8.9 to +5.2 in 14 bars, which is strong upward momentum. [Bullish]
- Bollinger Bands (20): Upper $370.85, lower $317.11. Price closed at $377.10, above the upper band, after a two-day breakout. The bands are wide, so the measure is stretched. Closes outside the band signal strong momentum, but they often lead to a retest of the upper band or the midline (~$344). [Neutral]
- CMF (20): 0.302, well above +0.05 and rising steadily since Oct 22 (0.091). This is strong accumulation, and the breakout is backed by buying pressure. [Accumulation]
- ADX (14): 39.8 with +DI 45.0 and −DI 11.6. ADX has turned up from 37.9 and +DI is far above −DI, so the new uptrend is strong. The DI spread is wide and bulls are firmly in control. [Strong Trend + Bullish]
- Volume: 12.4K, with a green bar on the breakout candle. The last bar is among the larger recent bars, which supports the move, though absolute volume is not exceptional. [Moderately confirming bullish]
DIVERGENCES & TRENDS
- No bearish RSI or MACD divergence. Both made new momentum highs alongside price, which confirms the move.
- The EMA21/EMA55 bullish cross is imminent (gap about $2.30 and narrowing quickly).
- SMA50D ($351.49) is flattening and falling toward SMA200D ($354.89). SMA50D remains below SMA200D, so no golden cross yet, and a death cross has not completed. Price has reclaimed both SMA50D and SMA200D, a bullish long-term reclaim. VWAP ($352.56) is well below price.
- Price is above all moving averages after a Sep–Oct low near $327. The rebound is a V-shaped recovery of about 15%.
- Price is above the upper Bollinger Band and RSI is above 75, so short-term overextension is the main risk. In similar spots earlier in the year (the July RSI peak near 72), price consolidated and then rolled over within weeks.
- The two-day gain is about 6.4% (354.35 to 377.10), so the move is gap-like and prone to partial retracement.
CHART PATTERNS
- Bullish Inverted Head and Shoulders / Double Bottom (loose): The Sep–Oct low near $327 followed the earlier Apr low and the Jun trough (~$340). A base formed and has now broken above the $355–$357 resistance cluster (SMA200D, prior swing highs). The measured move from the $327 low to the $355 neckline is about $28, which projects to around $383 and beyond.
- Resistance to watch: The prior high near $390–$400 (July/Aug peak at about $396–$400, with the upper band at $404). This is the larger overhead supply zone.
- Failed-rally risk: After a 6% two-day gap, price may retest the breakout zone ($355–$365) before continuing, similar to a bullish flag/pennant forming.
POTENTIAL SCENARIOS
- Scenario 1: Bullish Breakout Continuation After Brief Consolidation — Price digests the gain, holds above the $355–$362 breakout zone, and resumes higher as ADX/CMF stay strong. Trigger: Hold above ~$360 and close above $385. Target: $392–$405 (prior highs). Invalidation: Daily close below $352 (SMA200D/EMA cluster). (50% probability)
- Scenario 2: Bearish Mean-Reversion Pullback — RSI above 75 and the close above the upper band fuel a retracement toward the moving-average cluster; the breakout fails to hold and price fills back toward $350–$360. Trigger: Close below $365, then $355. Target: $350–$358. Invalidation: Sustained close above $385. (30% probability)
- Scenario 3: Neutral Range Digestion — Price chops between $360 and $385 as momentum cools. Trigger: Failure to break either $385 or $360. Target: $365–$380. Invalidation: Close outside $355–$392. (20% probability)
PRICE TARGETS
Over 47 days, the strong trend (ADX 39.8, CMF 0.30, MACD expanding, fresh breakout above all MAs) outweighs the overbought risk. The base case is a modest pullback and consolidation, then a grind higher, with a target modestly above current price.
- Target Price: $386.00 (47 days)
- Expected Range: $350.00 to $402.00 (width $52, about 13.8% of current price, consistent with the 30–60 day guidance of ~12–18%)
- Key Levels: Support at $362.00 (nearest meaningful level below price: breakout zone and upper-band retest area), Resistance at $397.00 (July/Aug swing highs)
OVERALL BIAS
OVERALL BIAS: BULLISH - Strong trend confirmation (ADX 39.8 with +DI 45 vs −DI 11.6), expanding MACD, CMF at 0.30 accumulation, and a breakout above every key moving average argue for continuation toward the $390s. The main risk is a short-term overbought pullback (RSI 75.5, price above the upper band), which would likely retest $355–$365 first.
This is educational analysis and not financial advice.