QQQM 413-day bullish forecast — Oct 31, 2026
- Bias: Bullish
- Timeframe: 413 days (made Oct 31, 2026, target date Dec 17, 2027)
- Price at analysis: $284.34
- Price target: $318.00
- Expected range: $250.00 – $370.00
- Result: Pending — graded after the close on Dec 17, 2027
Get a free AI analysis of QQQM today
Analysis
TECHNICAL INDICATORS
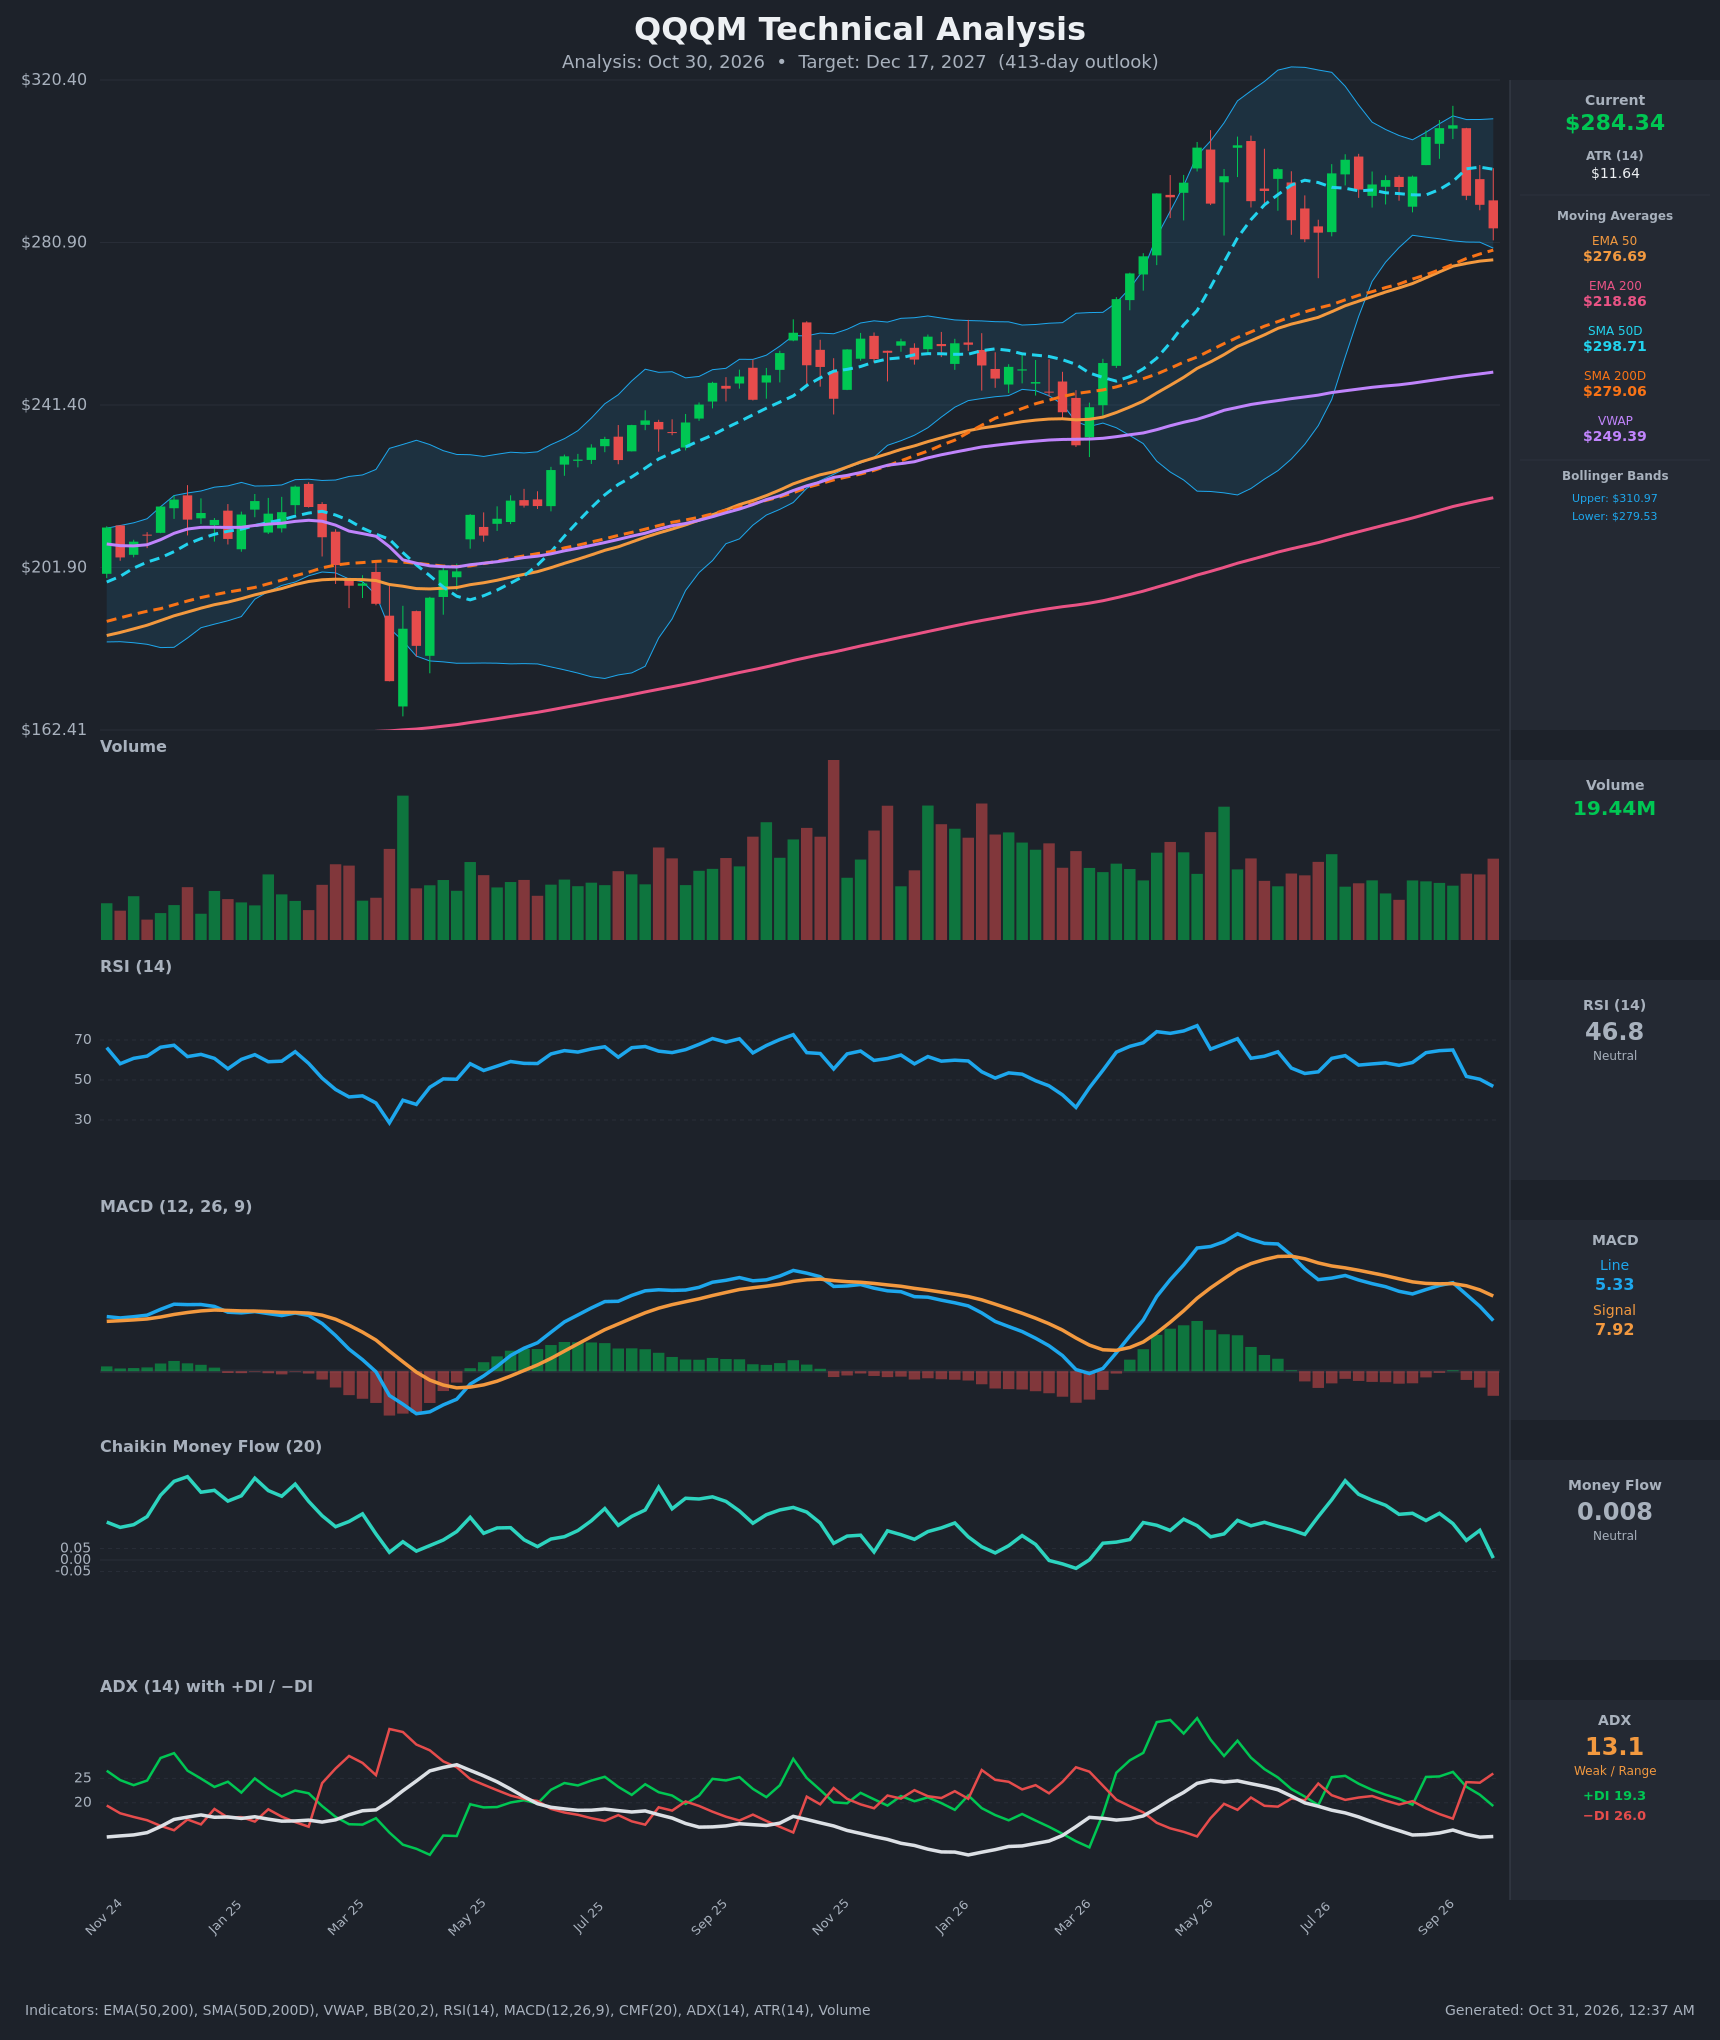
- RSI (14): 46.81, down from 65.0 about 3 bars ago and below the 50 midline. Momentum is fading but not oversold (the March 2026 low was near 35), so there is room to fall further. [Bearish]
- 20 EMA: The 20 EMA isn't supplied. The EMA 50 at $276.69 and SMA 200 at $279.06 form a support cluster just under price ($284.34). The dashed cyan SMA 50 at $298.71 is now overhead resistance. Price is above the EMA 50 and SMA 200 but below the SMA 50. [Neutral]
- MACD: Line 5.33 is below signal 7.92, and the histogram is negative and widening. The bearish cross happened in late summer and has deepened since the October drop. Both lines are still above zero, so this is a pullback in a larger uptrend rather than a full trend reversal. [Bearish]
- Bollinger Bands (20): Upper $310.97, lower $279.53. Price at $284.34 sits in the lower quarter of the band after a rejection at the upper band (~$309). The bands are moderately narrow, suggesting a consolidation. A close under $279.53 would be a bearish band walk. [Bearish]
- CMF (20): 0.008, down from 0.345 in early August, and now inside the neutral ±0.05 zone. Accumulation has faded and is trending toward distribution. [Neutral]
- ADX (14): 13.1, which is weak and range-bound. −DI (26.0) is above +DI (19.3) after a bearish DI crossover, so sellers have a short-term edge but there is no real trend. [Weak Trend, Bearish lean]
- Volume: 19.44M, with the latest bars red and above recent average. Volume was heavier on the October decline than on the September advance, which points to mild distribution. It is not capitulation. [Mildly Bearish]
DIVERGENCES & TRENDS
- Price made a similar high in Sep/Oct (~$309) to the spring peak (~$310), while MACD peaked lower (9.3 vs. 12+) and ADX stayed weak. This is a mild bearish momentum divergence at the highs.
- CMF fell from 0.345 to 0.008, so buying pressure is draining while price stays elevated.
- MACD crossed bearish and is still widening. RSI has dropped below 50.
- The EMA 50 and SMA 200 are converging at ~$277-279 and price is testing them. The EMA 50 is above the EMA 200 and the SMA 50 is above the SMA 200, so the golden cross remains intact. The gap between the SMA 50 and SMA 200 is narrowing, which is worth monitoring for a future death cross.
- Price is above the SMA 200 ($279.06) and far above the EMA 200 ($218.86), which keeps the long-term uptrend structurally intact.
- Price is below VWAP's anchor? No: price ($284.34) is well above VWAP ($249.39), a long-term bullish positioning signal.
CHART PATTERNS
- Bearish Double Top (Reversal): Highs near $309-311 in spring and again in Sep/Oct, with a neckline near $273-280. A break below ~$279 would give a measured target of roughly $245-250 (about $35 pattern height).
- Range / Symmetrical Consolidation (Continuation): Since April 2026 price has oscillated between ~$273 and ~$310 with weak ADX. A break above $311 would target ~$345-350 (range height added).
- The larger structure is a stair-step uptrend from the $165 low in 2025. Support is the $277-279 MA cluster and the pattern needs a decisive neckline break to turn bearish.
POTENTIAL SCENARIOS
- Scenario 1: Bullish Range Resolution to the Upside — The $277-279 MA cluster holds, the range resolves upward, and the long-term trend (price far above the 200-day averages) resumes with earnings-driven growth. Trigger: weekly close above $311 with MACD back above signal and CMF above +0.05. Target: $318 at 413 days, with an extension to $350-370. Invalidation: sustained close below $270. (50% probability)
- Scenario 2: Bearish Double-Top Breakdown — The neckline at $279 fails, the death-cross risk grows, and price falls toward the $245-250 area (the old resistance/VWAP zone) before any recovery. Trigger: daily close under $273 on rising volume with −DI above 25 and ADX rising. Target: $245-250, with $220 (EMA 200) in an extended bear case. Invalidation: reclaim of $298 (SMA 50). (35% probability)
- Scenario 3: Neutral Prolonged Consolidation — Price chops between $270 and $311 for most of the horizon. Trigger: ADX stays below 20. Target: $285-300. Invalidation: close outside the $265-$315 range. (15% probability)
PRICE TARGETS
Range width check: $370 − $250 = $120, which is 42.2% of $284.34. That falls within the 35-60% guidance for a 366-730 day timeframe (413 days).
- Target Price: $318.00 (413 days)
- Expected Range: $250.00 to $370.00
- Key Levels: Support at $276.69, Resistance at $310.97
OVERALL BIAS
OVERALL BIAS: BULLISH - Over a 413-day horizon the structural uptrend (price above the SMA 200, a golden-cross configuration, and price far above the EMA 200 and VWAP) outweighs the near-term bearish signals (MACD below signal, −DI above +DI, RSI under 50, possible double top). Those near-term signals are weakened by a very low ADX of 13.1. A close below $273 would challenge this view.
This is educational analysis and not financial advice.