DXYZ 6-day bearish forecast — Nov 1, 2026
- Bias: Bearish
- Timeframe: 6 days (made Nov 1, 2026, target date Nov 6, 2026)
- Price at analysis: $25.39
- Price target: $24.70
- Expected range: $24.15 – $25.90
- Result: Correct (-4.0%) — closed at $24.37 on Nov 6, 2026; quality score 100/100
Get a free AI analysis of DXYZ today
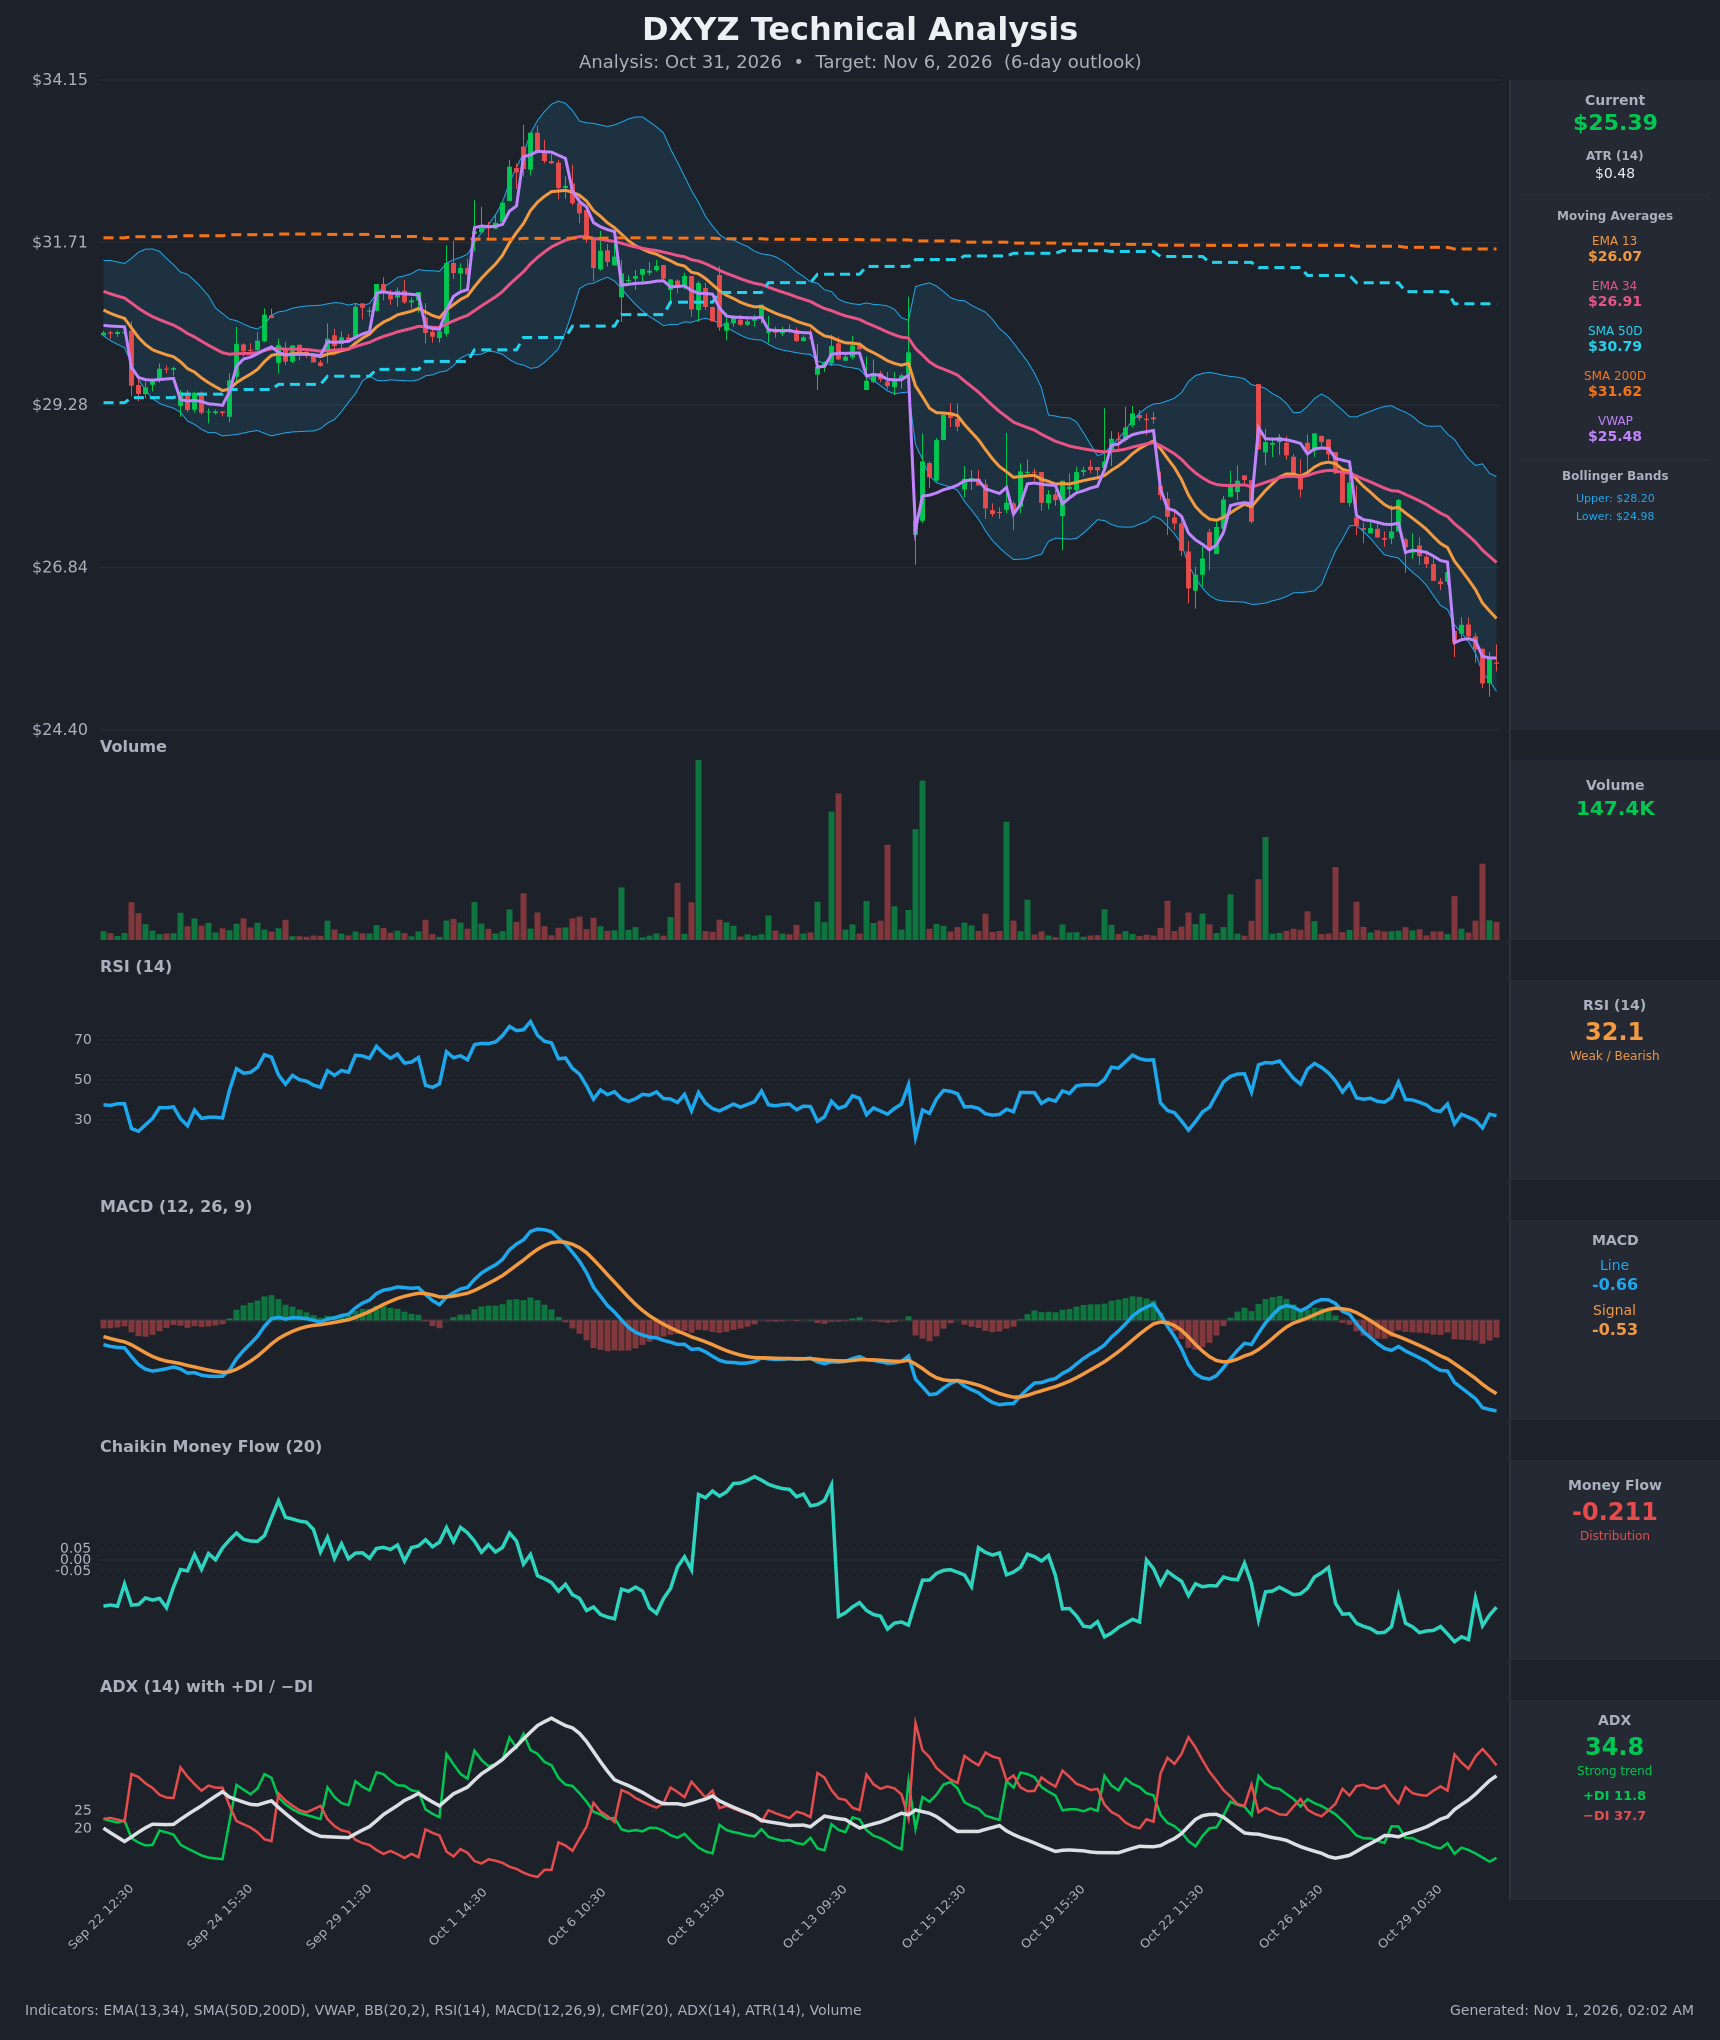
Analysis
TECHNICAL INDICATORS
- RSI (14): 32.15, near oversold but not yet below 30. It touched 26-28 on Oct 30 and bounced only to the low 30s. The downtrend in momentum is intact, with no bullish divergence yet. [Bearish]
- 20 EMA: The nearest provided average is the EMA 13 at $26.07, with the EMA 34 at $26.91. Price at $25.40 is well below both, and both are falling, so they act as overhead resistance. [Bearish]
- MACD: Line -0.659 is below Signal -0.533, with a widening negative histogram. The line is making new lows and the gap is expanding, so there is no sign of a bullish cross. [Bearish]
- Bollinger Bands (20): Upper $28.20, lower $24.98. Price is hugging the lower band (about 10% of the band width above it). The bands are widening to the downside, which fits a trend "walk" along the lower band rather than a squeeze. A mean-reversion bounce is possible, but a band walk can persist. [Bearish]
- CMF (20): -0.211, well below -0.05. It has been negative for most of the past few weeks, meaning sustained distribution and selling pressure. [Distribution]
- ADX (14): 34.8 and rising, with −DI 37.7 far above +DI 11.8. This is a strong, accelerating downtrend with bears firmly in control. [Strong Trend – Bearish]
- Volume: 147.4K, unremarkable and well below the spike bars seen earlier in October. There are no capitulation-type volume surges, so the decline looks orderly rather than exhausted. [Neutral to mildly Bearish]
DIVERGENCES & TRENDS
- There is no bullish RSI or MACD divergence. Both made new lows alongside price (RSI hit 26.1 and 28.0 while price fell to $25.10).
- The EMA 13 is below the EMA 34 and the gap is widening. The bearish EMA cross was established earlier in the downtrend.
- The SMA 50 ($30.79) is below the SMA 200 ($31.62). This is a death-cross structure, and price is about 20% below the SMA 200, which confirms a long-term downtrend.
- Price is below VWAP ($25.48) by a small margin, which is mildly bearish. Intraday bounces have been failing around VWAP.
- The ADX has risen from 17.7 to 34.8 over the last 15 bars as −DI expanded, so trend strength is increasing.
- The stock is stretched. It is far below its moving averages and near the lower Bollinger Band with RSI near 30, so a relief bounce is plausible even within the downtrend.
CHART PATTERNS
- The chart shows a sequence of lower highs and lower lows, a descending channel resembling a Bearish Flag/Pennant continuation after the sharp drops on Oct 15 and Oct 30. A clean breakdown below $24.98 would target a measured move toward roughly $24.00-$24.40.
- A Bullish Falling Wedge reversal is a possibility if price compresses into the lower band and then breaks above the wedge resistance. That is not confirmed. It would need a reclaim of VWAP and the EMA 13 (~$26.07).
- There is no confirmed reversal pattern, so the trend structure remains in the bears' favor.
POTENTIAL SCENARIOS
- Scenario 1: Bearish Trend Continuation — Price keeps walking the lower Bollinger Band as ADX and −DI stay dominant and CMF stays deeply negative. Trigger: break and hourly close below $24.98. Target: $24.40-$24.70, extension to ~$24.15. Invalidation: close above the VWAP/EMA 13 area at $26.07. (55% probability)
- Scenario 2: Bullish Oversold Relief Bounce — RSI near 30 and price at the lower band trigger a mean-reversion rally, but it stalls under the falling EMAs. Trigger: reclaim of $25.48 (VWAP) with a rising RSI. Target: $26.07 (EMA 13), possibly $26.50. Invalidation: rejection at VWAP and a new low below $24.98. (30% probability)
- Scenario 3: Neutral Choppy Base — Price consolidates between the lower band and VWAP while momentum cools. Trigger: failure to break either $24.98 or $26.07 for several sessions. Target: $25.00-$25.70. Invalidation: decisive break of either level. (15% probability)
PRICE TARGETS
- Target Price: $24.70 (6-day, about -2.7%)
- Expected Range: $24.15 to $25.90 (width $1.75, about 6.9% of the current price, consistent with the 6-day timeframe)
- Key Levels: Support at $24.98 (lower Bollinger Band; below that, $24.40), Resistance at $26.07 (EMA 13; VWAP at $25.48 is the first hurdle)
OVERALL BIAS
OVERALL BIAS: BEARISH - A strong, accelerating downtrend (ADX 34.8, −DI 37.7 vs +DI 11.8), MACD below signal and widening, CMF at -0.21, and price below all moving averages and VWAP. Oversold conditions raise the risk of a relief bounce, but with no divergence or reversal pattern the path of least resistance remains lower.
This is educational analysis and not financial advice.