CVX 46-day bullish forecast — Nov 2, 2026
- Bias: Bullish
- Timeframe: 46 days (made Nov 2, 2026, target date Dec 18, 2026)
- Price at analysis: $235.52
- Price target: $241.50
- Expected range: $223.00 – $257.00
- Result: Pending — graded after the close on Dec 18, 2026
Get a free AI analysis of CVX today
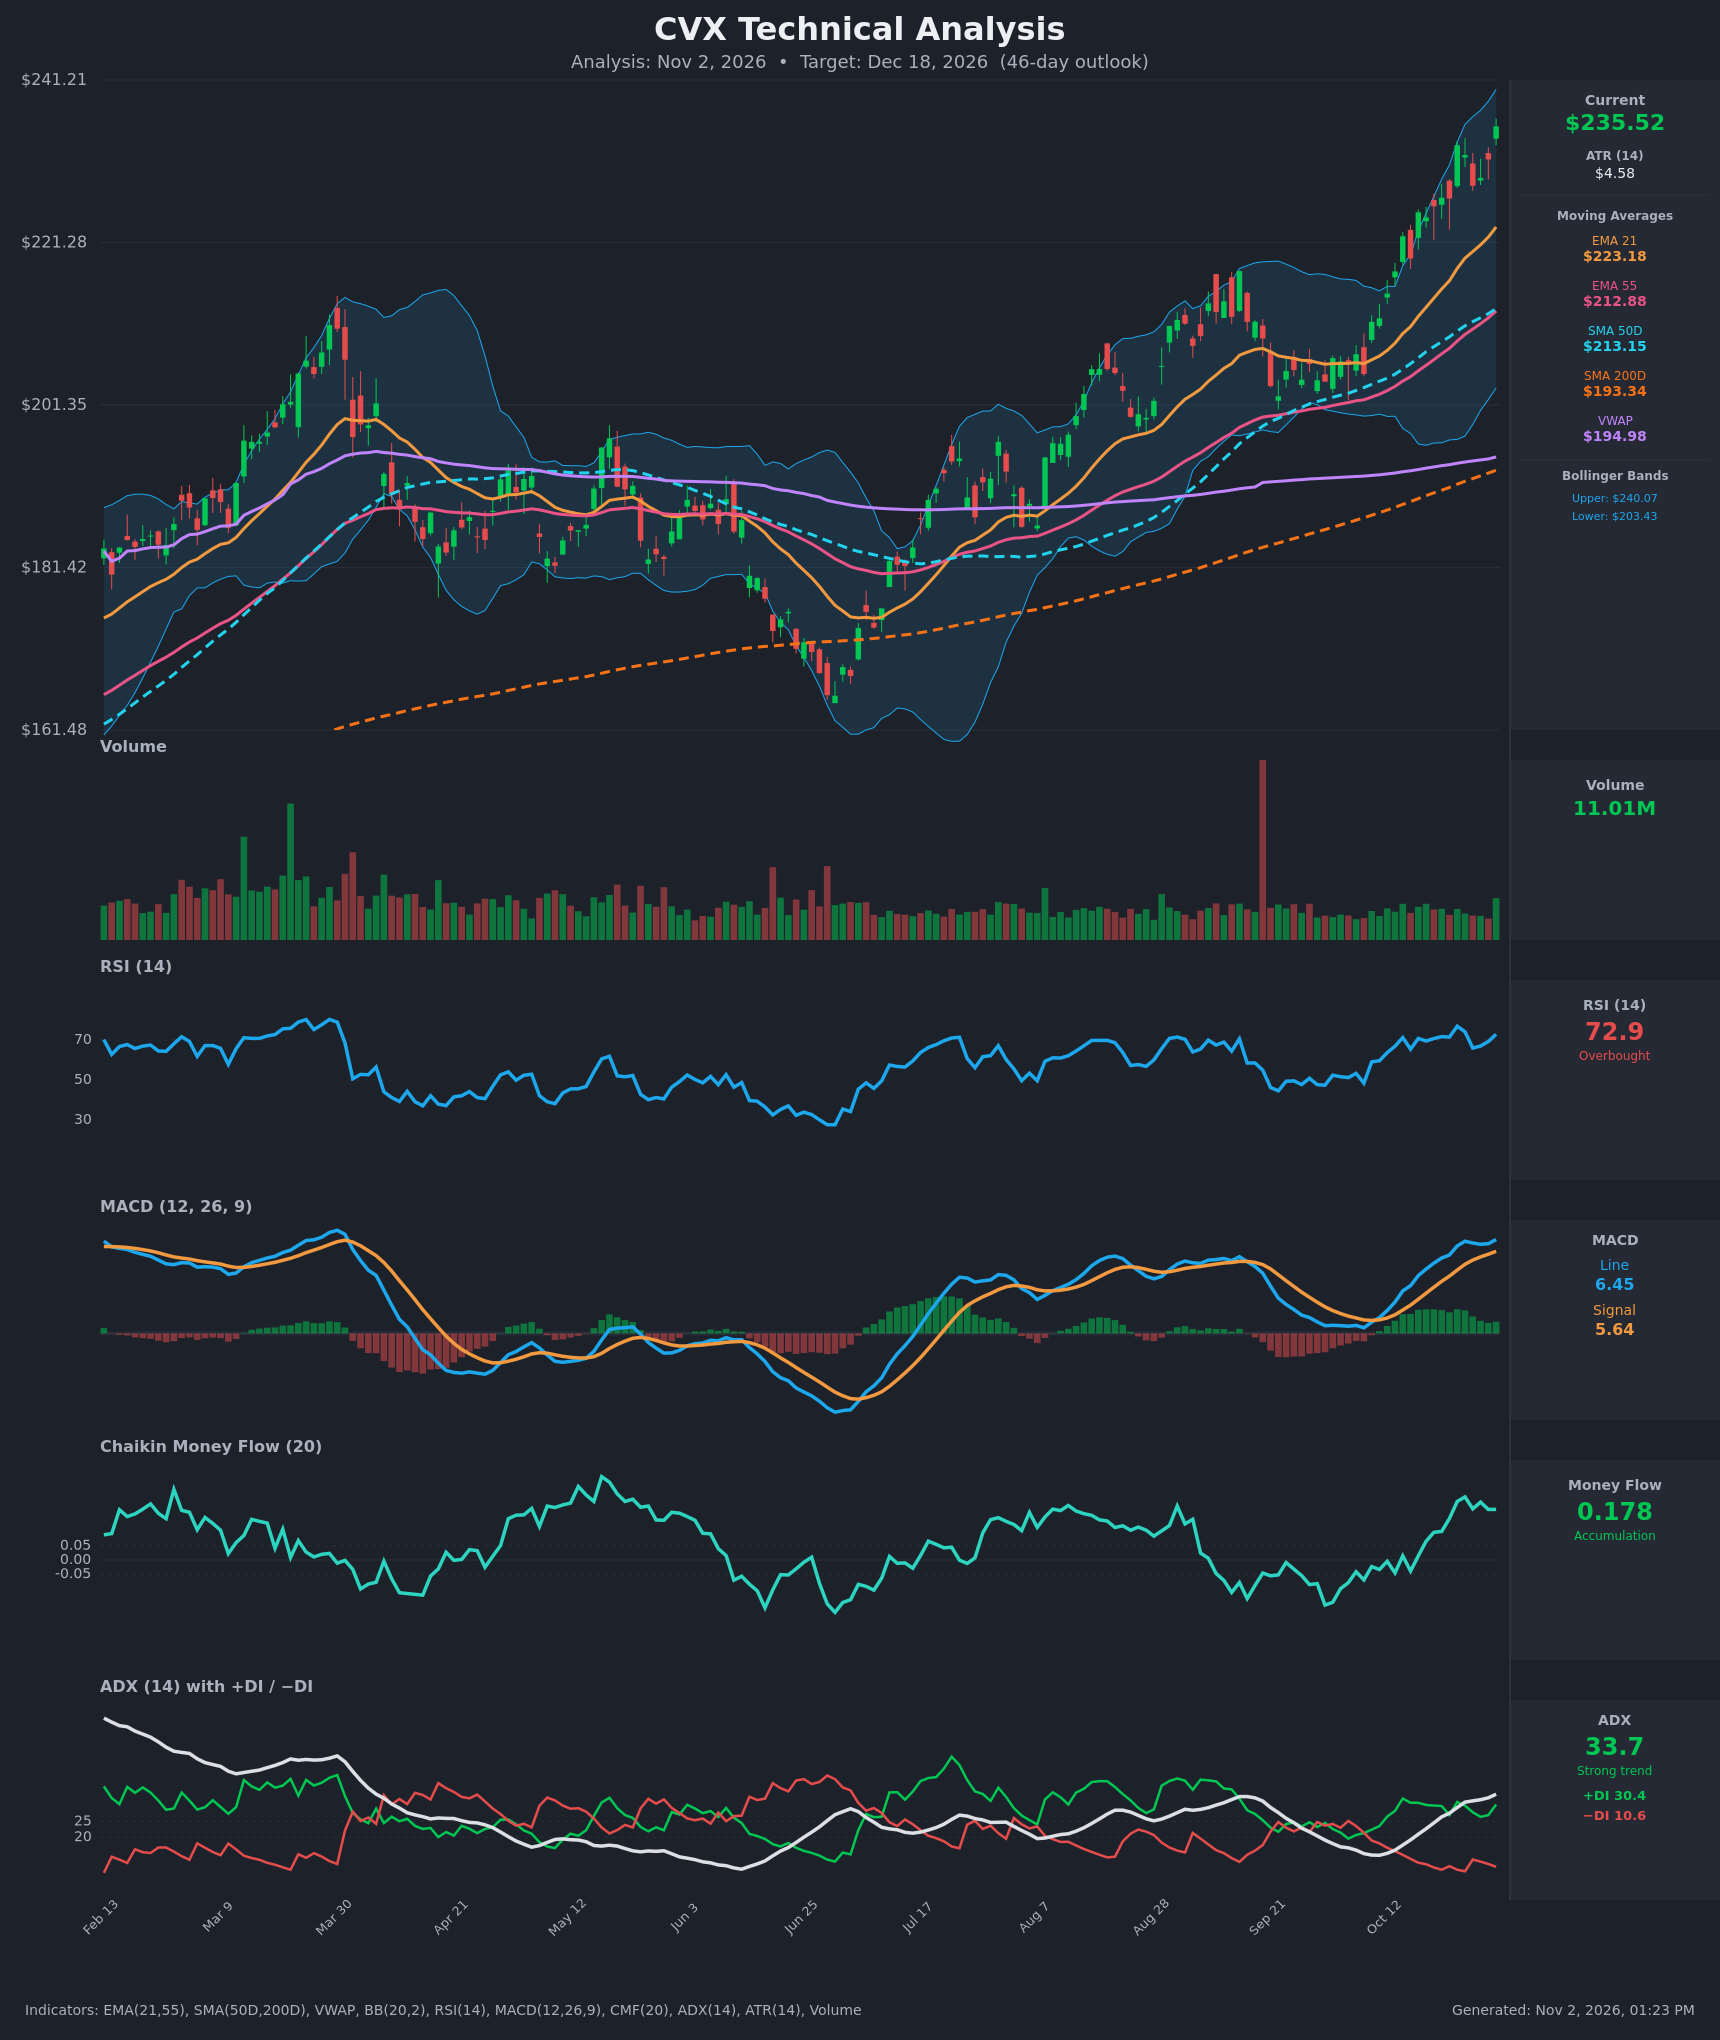
Analysis
TECHNICAL INDICATORS
- RSI (14): 72.85, overbought. It has held in the 65-77 band since mid-October and peaked at 76.9 on Oct 23. Pullbacks to about 65-66 (Oct 15, Oct 27) were bought quickly, which is typical of a strong trend. Overbought alone is a caution for pace, not a reversal signal. [Bullish]
- 20 EMA: The data gives EMA 21 at $223.18 and price at $235.52, about 5.5% above it. The EMA has been rising steadily for 15 bars and has acted as dynamic support. The gap also means the move is stretched. [Bullish]
- MACD: Line 6.45 is above signal 5.64, a positive spread of about 0.81. The line made a fresh high on Oct 30 and the histogram is positive and expanding again after a brief dip on Oct 27-28. There is no bearish crossover. [Bullish]
- Bollinger Bands (20): Upper $240.07, lower $203.43, so the midpoint is about $221.75. Price at $235.52 sits in the upper quarter of the bands, which have been expanding. Price has been riding the upper half since mid-October. That is a trend-walk, but it leaves only about $4.55 (1.9%) of room to the upper band. [Bullish]
- CMF (20): 0.178, well above +0.05. It has risen from about 0 on Oct 12-14 to above 0.2 and has held there. This is sustained accumulation and confirms the rally. [Accumulation]
- ADX (14): 33.7 and rising, up from 14.9 on Oct 12. +DI is 30.4 against −DI at 10.6, a wide spread. This is a strong, established uptrend with bulls clearly in control. [Strong Trend + Bullish]
- Volume: 11.01M on the latest bar, a green candle that is above the recent bars on the chart. It is not climactic and there is no blow-off spike. Volume is supportive but not euphoric, which is consistent with an orderly advance. [Mildly Bullish / Confirming]
DIVERGENCES & TRENDS
- No bearish divergence on the key momentum tools. Price made a new high on Oct 30 and MACD (6.45) and CMF (0.178) did not fail to confirm. RSI at 72.85 is slightly below its Oct 23 peak of 76.9, but price is also only slightly above that day's close ($233.21), so this is a mild momentum plateau rather than a true divergence.
- Moving average structure is fully bullish. Price ($235.52) is above EMA21 ($223.18), EMA55 ($212.88), SMA50D ($213.15), SMA200D ($193.34) and VWAP ($194.98).
- The EMA21 crossed above EMA55 well before this window. It has widened steadily from 4.9 to 10.3 points over the last 15 bars. SMA50D has stayed above SMA200D (about $20 apart), so the golden cross remains intact.
- ADX and the DIs agree. ADX has risen from the 20s into the 30s with +DI far above −DI.
- Extension is the main risk. Price is about 10.5% above SMA50D and about 22% above SMA200D, and VWAP is far below price. Pullbacks toward EMA21 are normal, but they would not break the trend.
- Trend context on the chart. CVX has made a higher low in Sep (~$195-200) after the June trough near $165, and has broken above the Aug high (~$219).
CHART PATTERNS
- Bullish base and breakout. The June low, July recovery, and Sep higher low formed a multi-month base. The breakout above the Aug high near $219 completes a bullish reversal and continuation structure similar to the Bullish Double Bottom in the reference diagram.
- Minor Bullish Flag / Pennant. The brief consolidation from Oct 26-28 ($228-232) after the Oct 12-23 thrust matches the diagram's Bullish Flag/Pennant continuation. The pole runs from about $215 to $233 (~$18), so the measured move from the flag breakout near $230 is about $246-248.
- Near-term resistance. The upper Bollinger Band at $240.07 and the chart high near $241 are the first hurdle. The pattern targets point to about $246.
POTENTIAL SCENARIOS
- Scenario 1: Bullish Trend Continuation — The strong ADX, accumulation and stacked MAs carry price above the upper band after a brief pause. Trigger: a daily close above $240-241 on steady volume. Target: $246-250, the flag measured move. Invalidation: a close below $223 (EMA21). (50% probability)
- Scenario 2: Neutral/Bearish Overbought Pullback and Consolidation — RSI cools from overbought and price reverts toward EMA21 and the BB midline ($222-228), then chops sideways or rebuilds. Trigger: a bearish MACD cross or a close below $228. Target: $220-226. Invalidation: a rebound that holds above $235 and a close above $240. (35% probability)
- Scenario 3: Bearish Trend Failure — A momentum exhaustion reversal breaks EMA21 and heads toward the SMA50D/EMA55 zone. Trigger: a daily close below $222 with expanding volume and −DI rising. Target: $212-214. Invalidation: a reclaim of $230. (15% probability)
PRICE TARGETS
For the 46-day horizon (Dec 18, 2026):
- Target Price: $241.50
- Expected Range: $223.00 to $257.00. This is a $34 width, about 14.4% of the current price, within the 12-18% guidance for 30-60 days.
- Key Levels: Support at $223.18 (EMA21; the nearest swing support is around $228), Resistance at $246.00 (measured-move target; first hurdle is the upper BB near $240.07).
OVERALL BIAS
OVERALL BIAS: BULLISH - A strong ADX (33.7) with +DI far above −DI, sustained CMF accumulation, a MACD above its signal and fully stacked moving averages point to continuation. Overbought RSI and the stretch above EMA21 raise the odds of a pause, so the target is only modestly above the current price.
This is educational analysis and not financial advice.