AAOI 5-day bearish forecast — Nov 2, 2026
- Bias: Bearish
- Timeframe: 5 days (made Nov 2, 2026, target date Nov 6, 2026)
- Price at analysis: $66.71
- Price target: $64.80
- Expected range: $62.60 – $67.60
- Result: Correct (-24.9%) — closed at $50.10 on Nov 6, 2026; quality score 50/100
Get a free AI analysis of AAOI today
Analysis
TECHNICAL INDICATORS
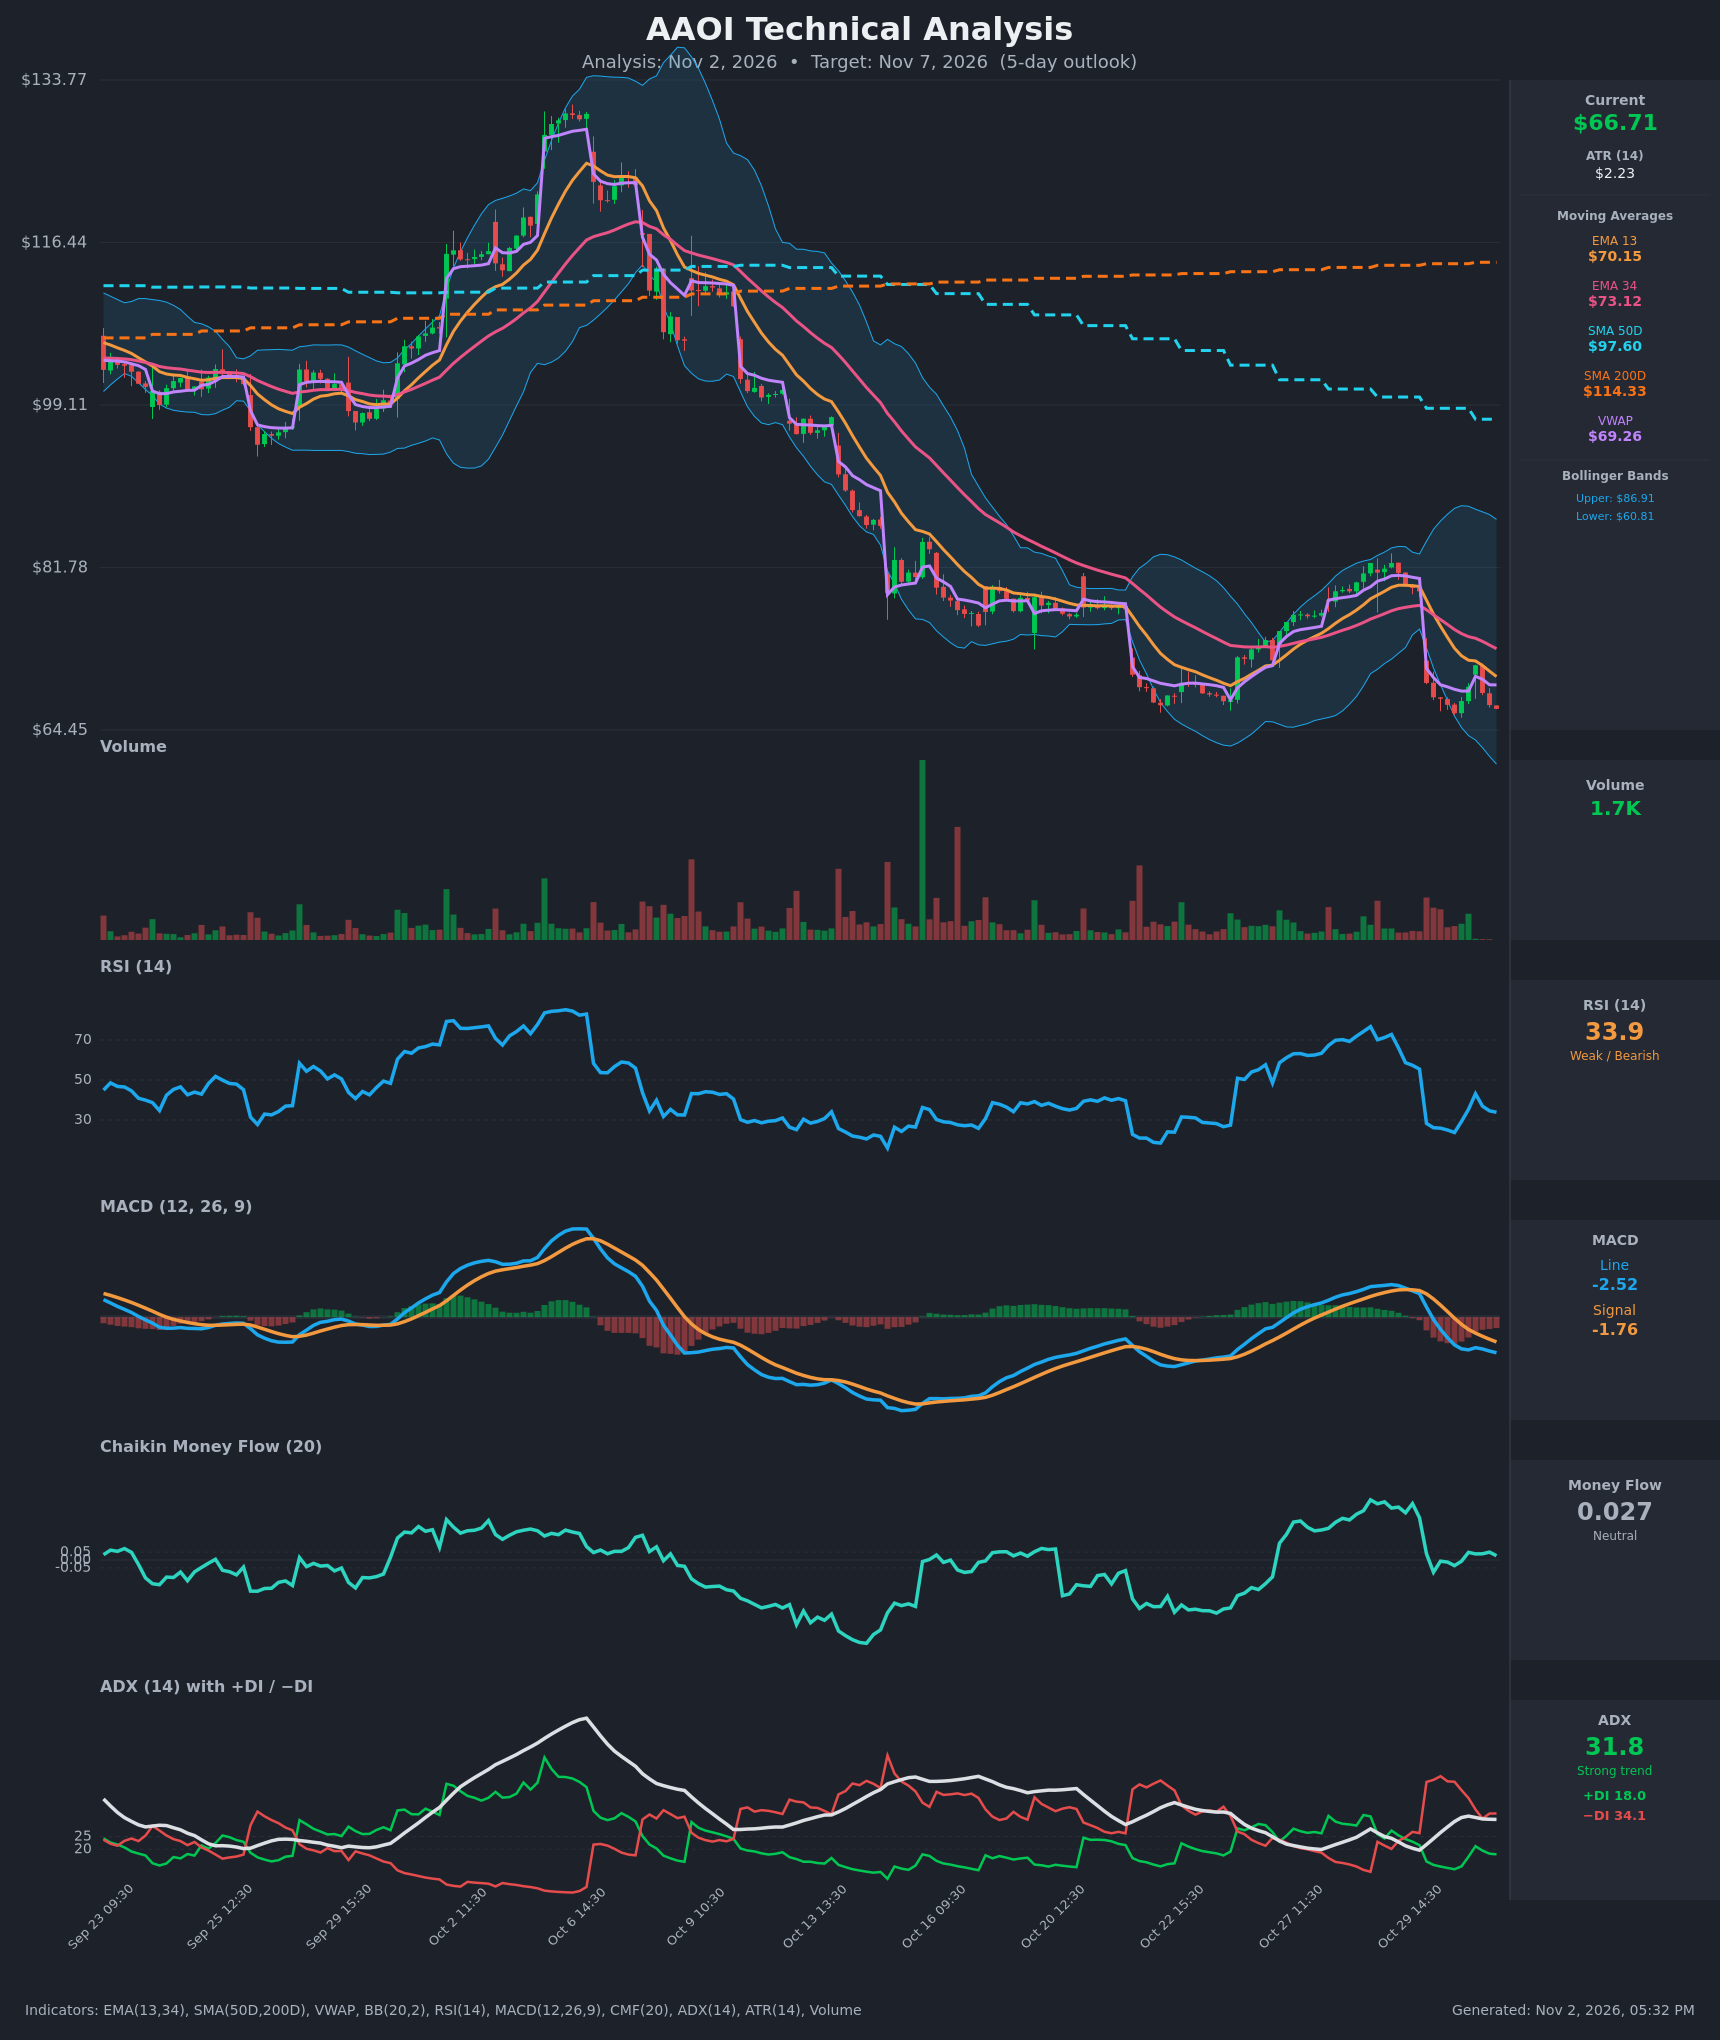
- RSI (14): 33.86, down from 43.1 on Nov 2 09:30 after a bounce from 23.7. It is close to oversold but not there yet, and it is still sloping lower. That leaves room for another leg down, though a relief bounce is possible. [Bearish]
- 20 EMA: The data gives EMA13 at $70.15 and EMA34 at $73.12. Price at $66.71 is below both, and EMA13 is below EMA34 (crossed bearish around Oct 30 11:30). Both are falling and act as overhead resistance. [Bearish]
- MACD: Line -2.52 is below Signal -1.76, and the histogram is about -0.77 and widening again. The bearish crossover happened around Oct 29, and the line is still diving after a brief flattening on Oct 30 15:30. [Bearish]
- Bollinger Bands (20): Upper $86.91, lower $60.82, with price at $66.71 in the lower third. The bands are wide after the gap-down. Price is below the midline (about $73.9) and walking toward the lower band. That is not yet a squeeze or an extreme, so there is room to test about $61-62. [Bearish]
- CMF (20): 0.027, neutral (between -0.05 and +0.05). It has faded from +0.34 pre-gap to roughly zero, so buying pressure has evaporated but there is no clear distribution yet. [Neutral]
- ADX (14): 31.8 with −DI 34.1 above +DI 18.0. This is a strong downtrend with bears firmly in control, though ADX is flat to slightly lower (33.1 → 31.8), so trend strength is plateauing. [Strong Trend – Bearish]
- Volume: The 1.7K reading is tiny and is likely a partial or low-participation bar. The largest bars on the chart came during the declines, and the recent bounce was on light volume, which means weak buying conviction. [Bearish / low conviction]
DIVERGENCES & TRENDS
- There is no bullish RSI divergence yet. RSI made a higher low (~25 to 28 area), but price is still printing lower lows, so no confirmed reversal signal.
- Price is far below the SMA50D ($97.60) and SMA200D ($114.33). The death cross is already in place (SMA50D below SMA200D), so the long-term trend is firmly down.
- Price gapped down from about $79 to $69 on Oct 30, then bounced to $71.36 on Nov 2 and was rejected. It then fell back to $66.71, below VWAP ($69.26).
- The sequence of lower highs on the EMAs, MACD and RSI points to renewed momentum loss after the failed bounce.
- The DI spread is wide (−DI 34.1 vs +DI 18.0), so sellers remain dominant even as the bounce faded.
CHART PATTERNS
- Bearish Flag / Pennant (continuation): After the sharp drop on Oct 30, price consolidated in a tight range of about $66-71.4 and is now slipping out of the bottom. The pattern implies continuation lower. The measured move is large, but over 5 days a partial move toward $62-64 is more realistic.
- Larger structure: Price has made a series of lower highs and lower lows since the $130 peak, a clear downtrend (similar to the descending-triangle / downtrend continuation family).
- Counterweight: A bullish pattern would need a reclaim of VWAP and EMA13 (about $69-70). That has not happened.
POTENTIAL SCENARIOS
- Scenario 1: Bearish Continuation Lower — Price is rejected under VWAP/EMA13 and slides toward the lower Bollinger Band as −DI stays dominant and MACD keeps widening. Trigger: break below the Oct 30 low area of about $66.25. Target: $63.00-$64.50 (lower band about $60.82 as an extension). Invalidation: close above $70.15 (EMA13). (55% probability)
- Scenario 2: Bullish Oversold Relief Bounce — RSI approaches oversold and shorts cover, producing a rebound toward the moving averages. Trigger: reclaim of VWAP at $69.26 on rising volume. Target: $70.15-$73.10 (EMA13/EMA34). Invalidation: failure at VWAP or a drop below $64.50. (30% probability)
- Scenario 3: Neutral Range Chop — Price stays in the $65-$69 pocket as ADX fades and CMF stays near zero. Trigger: holding $65 support while failing at $69. Target: $66-$68. Invalidation: a decisive break of either boundary. (15% probability)
PRICE TARGETS
- Target Price: $64.80 (5-day horizon, about -2.9%)
- Expected Range: $62.60 to $67.60 (width $5.00, about 7.5% of current price, consistent with the 5-day horizon and about 1.1x ATR-scaled daily moves)
- Key Levels: Support at $64.50, Resistance at $69.26 (VWAP, with EMA13 at $70.15 behind it)
OVERALL BIAS
OVERALL BIAS: BEARISH - Price is below all key moving averages with a death cross in place. MACD is below signal with a widening histogram, and −DI (34.1) dominates +DI (18.0) with ADX above 25. RSI is near but not at oversold, and the bounce failed under VWAP/EMA13 on weak volume, so a drift toward the lower Bollinger Band is more likely than a reversal. A relief bounce remains a real risk given the stretched condition.
This is educational analysis and not financial advice.