GS 19-day bearish forecast — Nov 2, 2026
- Bias: Bearish
- Timeframe: 19 days (made Nov 2, 2026, target date Nov 20, 2026)
- Price at analysis: $894.55
- Price target: $872.00
- Expected range: $830.00 – $922.00
- Result: Pending — graded after the close on Nov 20, 2026
Get a free AI analysis of GS today
Analysis
TECHNICAL INDICATORS
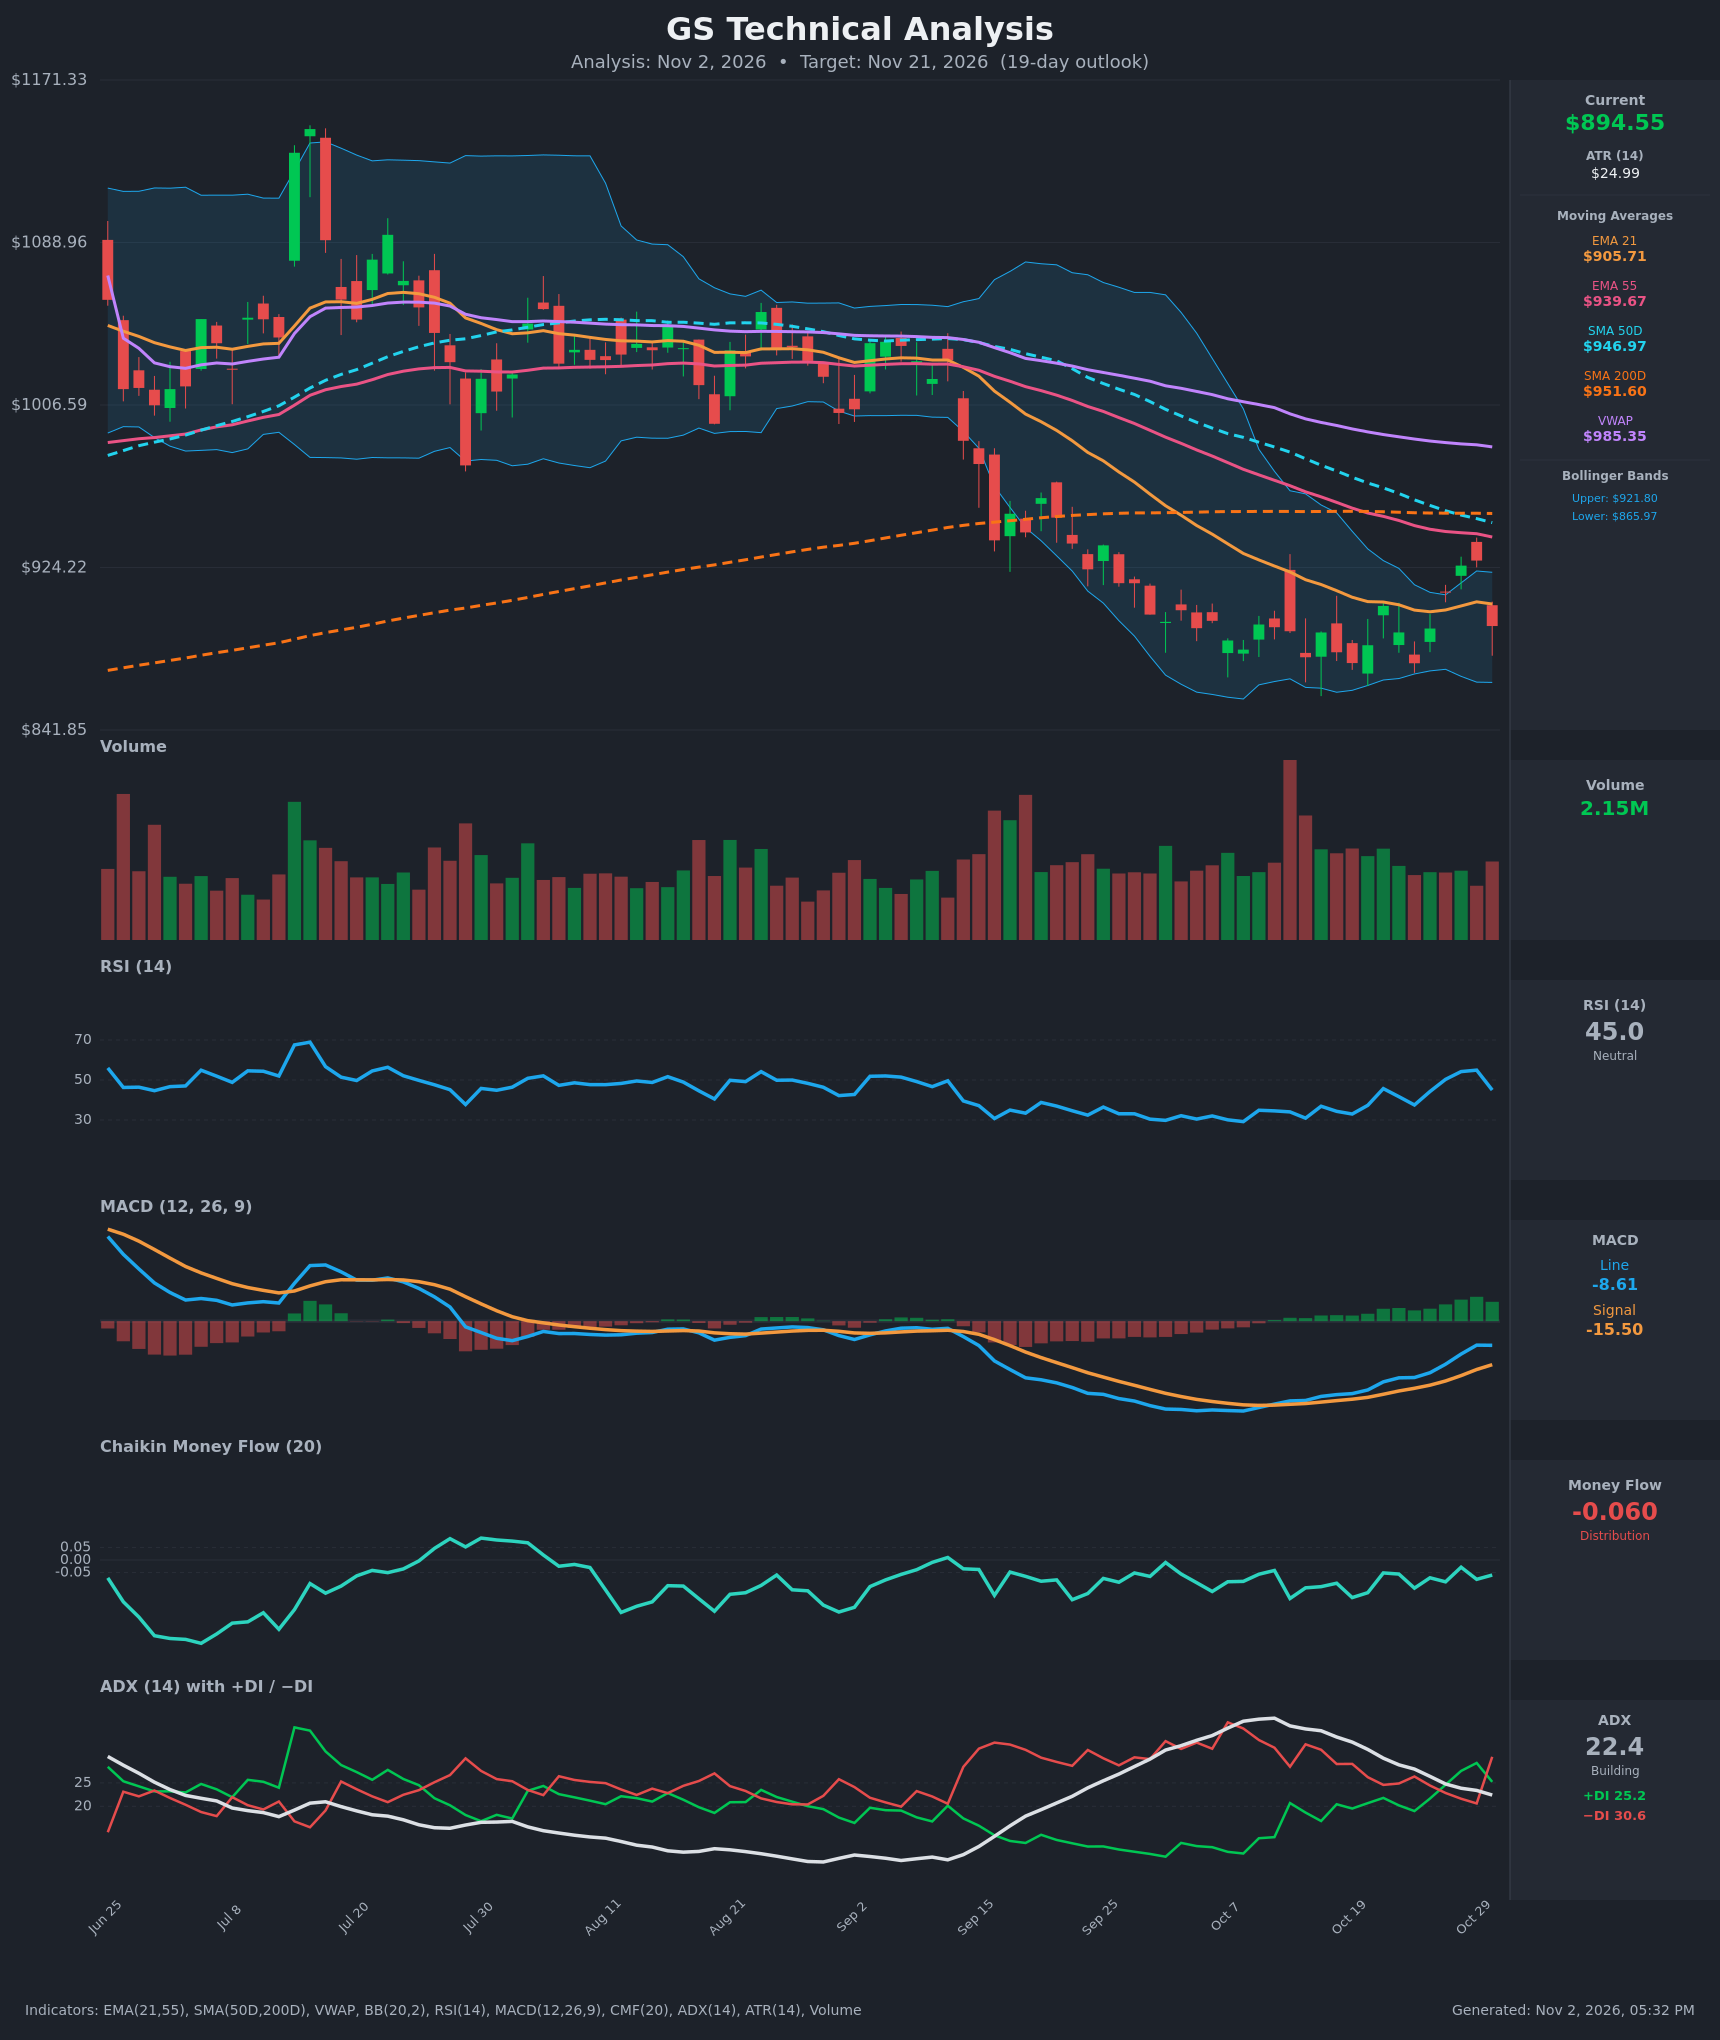
- RSI (14): 44.98. It peaked near 55 on Oct 29 and dropped sharply from 54.9 after the -3.6% reversal day. It is below the 50 midline and rolling over, but well above oversold (30). [Bearish]
- 20 EMA: The closest value given is EMA 21 at $905.71. Price at $894.55 is below it, and the reclaim to $927.73 on Oct 29 failed immediately. EMA 21 is also below EMA 55 ($939.67), so it acts as resistance. [Bearish]
- MACD: Line -8.61 is above signal -15.50, with a positive and expanding histogram. This is a bullish crossover from deep negative territory. However, the line stopped rising on the last bar (-8.54 to -8.61) and remains below zero, so the momentum improvement may be stalling after the sell-off. [Neutral]
- Bollinger Bands (20): Upper $921.80, lower $865.97, mid about $893.9. Price sits right on the midline after rejection from the upper-middle zone. The bands are narrowing after a big expansion, which suggests volatility compression. The price is stuck in the lower half of the longer-term band structure. [Neutral]
- CMF (20): -0.060, just below the -0.05 threshold. It has been negative and mostly in the -0.03 to -0.15 range for weeks, with no accumulation. [Distribution]
- ADX (14): 22.4 and falling from 38.8, so the trend is losing strength. −DI (30.6) flipped back above +DI (25.2) on the last bar after +DI had briefly led. Bears are regaining control, but the trend is moderate. [Weak/Moderate Trend, Bearish direction]
- Volume: 2.15M on a red candle, roughly average. The reversal day was not a capitulation spike, but sellers stepped in decisively at the declining EMAs. Volume has been light on the basing bounce. [Mildly Bearish]
DIVERGENCES & TRENDS
- MACD vs. price: MACD made a higher low while price made roughly equal lows around $875, a mild bullish divergence. It drove the Oct 21-29 bounce, but that bounce failed at resistance.
- Moving-average structure: Price is below EMA 21, EMA 55, SMA 50D ($946.97) and SMA 200D ($951.60). SMA 50D is below SMA 200D, so the death cross is in place and the long-term trend is down. VWAP at $985.35 is far above price, which shows persistent selling pressure.
- Trend strength: ADX has fallen from 38.8 to 22.4, so the downtrend is maturing into consolidation. A DI flip back to −DI above +DI on Oct 30 favors continuation lower.
- RSI: It made a higher high at 54.9 compared with prior bounces. The drop to 45 shows the rally lost momentum.
- CMF: It remains negative, with no bullish confirmation of the bounce.
CHART PATTERNS
- Range with lower highs: Price has been basing between about $866 and $930 for roughly three weeks after the September breakdown. That is a bearish continuation structure, like the Bearish Flag/Rectangle in the reference diagram. The recent rejection near $925-928 supports it.
- Bullish counterpoint: The multiple tests of $866-$875 form a possible Bullish Double/Triple Bottom base. It is not confirmed without a close above about $930.
- Targets: A breakdown below $866 measures toward about $835-$840 (range height of about $60 projected down). A breakout above $930 targets $950 (SMA 50D/200D cluster).
POTENTIAL SCENARIOS
- Scenario 1: Bearish Range Rejection and Breakdown — The failed bounce at EMA 21/EMA 55 resumes the downtrend, with −DI leading and CMF in distribution. Trigger: a daily close below $875, then below $866 (lower Bollinger Band). Target: $835-$870, with an extension toward $830. Invalidation: a daily close above $928. (52% probability)
- Scenario 2: Bullish Base Breakout — The MACD bullish crossover and higher lows turn into a double-bottom reversal. Trigger: a close above $928 on rising volume. Target: $946-$952 (SMA 50D/200D). Invalidation: a close below $866. (28% probability)
- Scenario 3: Neutral Chop in the Range — Price oscillates between $866 and $922 as ADX stays near 20. Trigger: no close beyond either boundary. Target: $885-$905. Invalidation: a close outside $866-$930. (20% probability)
PRICE TARGETS
- Target Price: $872.00 (19-day timeframe)
- Expected Range: $830.00 to $922.00 (width $92, about 10.3% of the current price, consistent with the 14-21 day guidance)
- Key Levels: Support at $865.97 (lower Bollinger Band and recent lows), Resistance at $905.71 (EMA 21), with a stronger ceiling at $921.80 (upper Bollinger Band)
OVERALL BIAS
OVERALL BIAS: BEARISH - Price is below all key moving averages with a death cross in place. −DI is back above +DI, CMF shows distribution, and the bounce was rejected at the EMA 21/EMA 55 zone. The MACD crossover and the $866 support base temper conviction, so the expected decline is modest.
This is educational analysis and not financial advice.