GOOG 5-day bullish forecast — Nov 2, 2026
- Bias: Bullish
- Timeframe: 5 days (made Nov 2, 2026, target date Nov 6, 2026)
- Price at analysis: $281.06
- Price target: $286.50
- Expected range: $274.00 – $294.00
- Result: Correct (+1.2%) — closed at $284.48 on Nov 6, 2026; quality score 100/100
Get a free AI analysis of GOOG today
Analysis
TECHNICAL INDICATORS
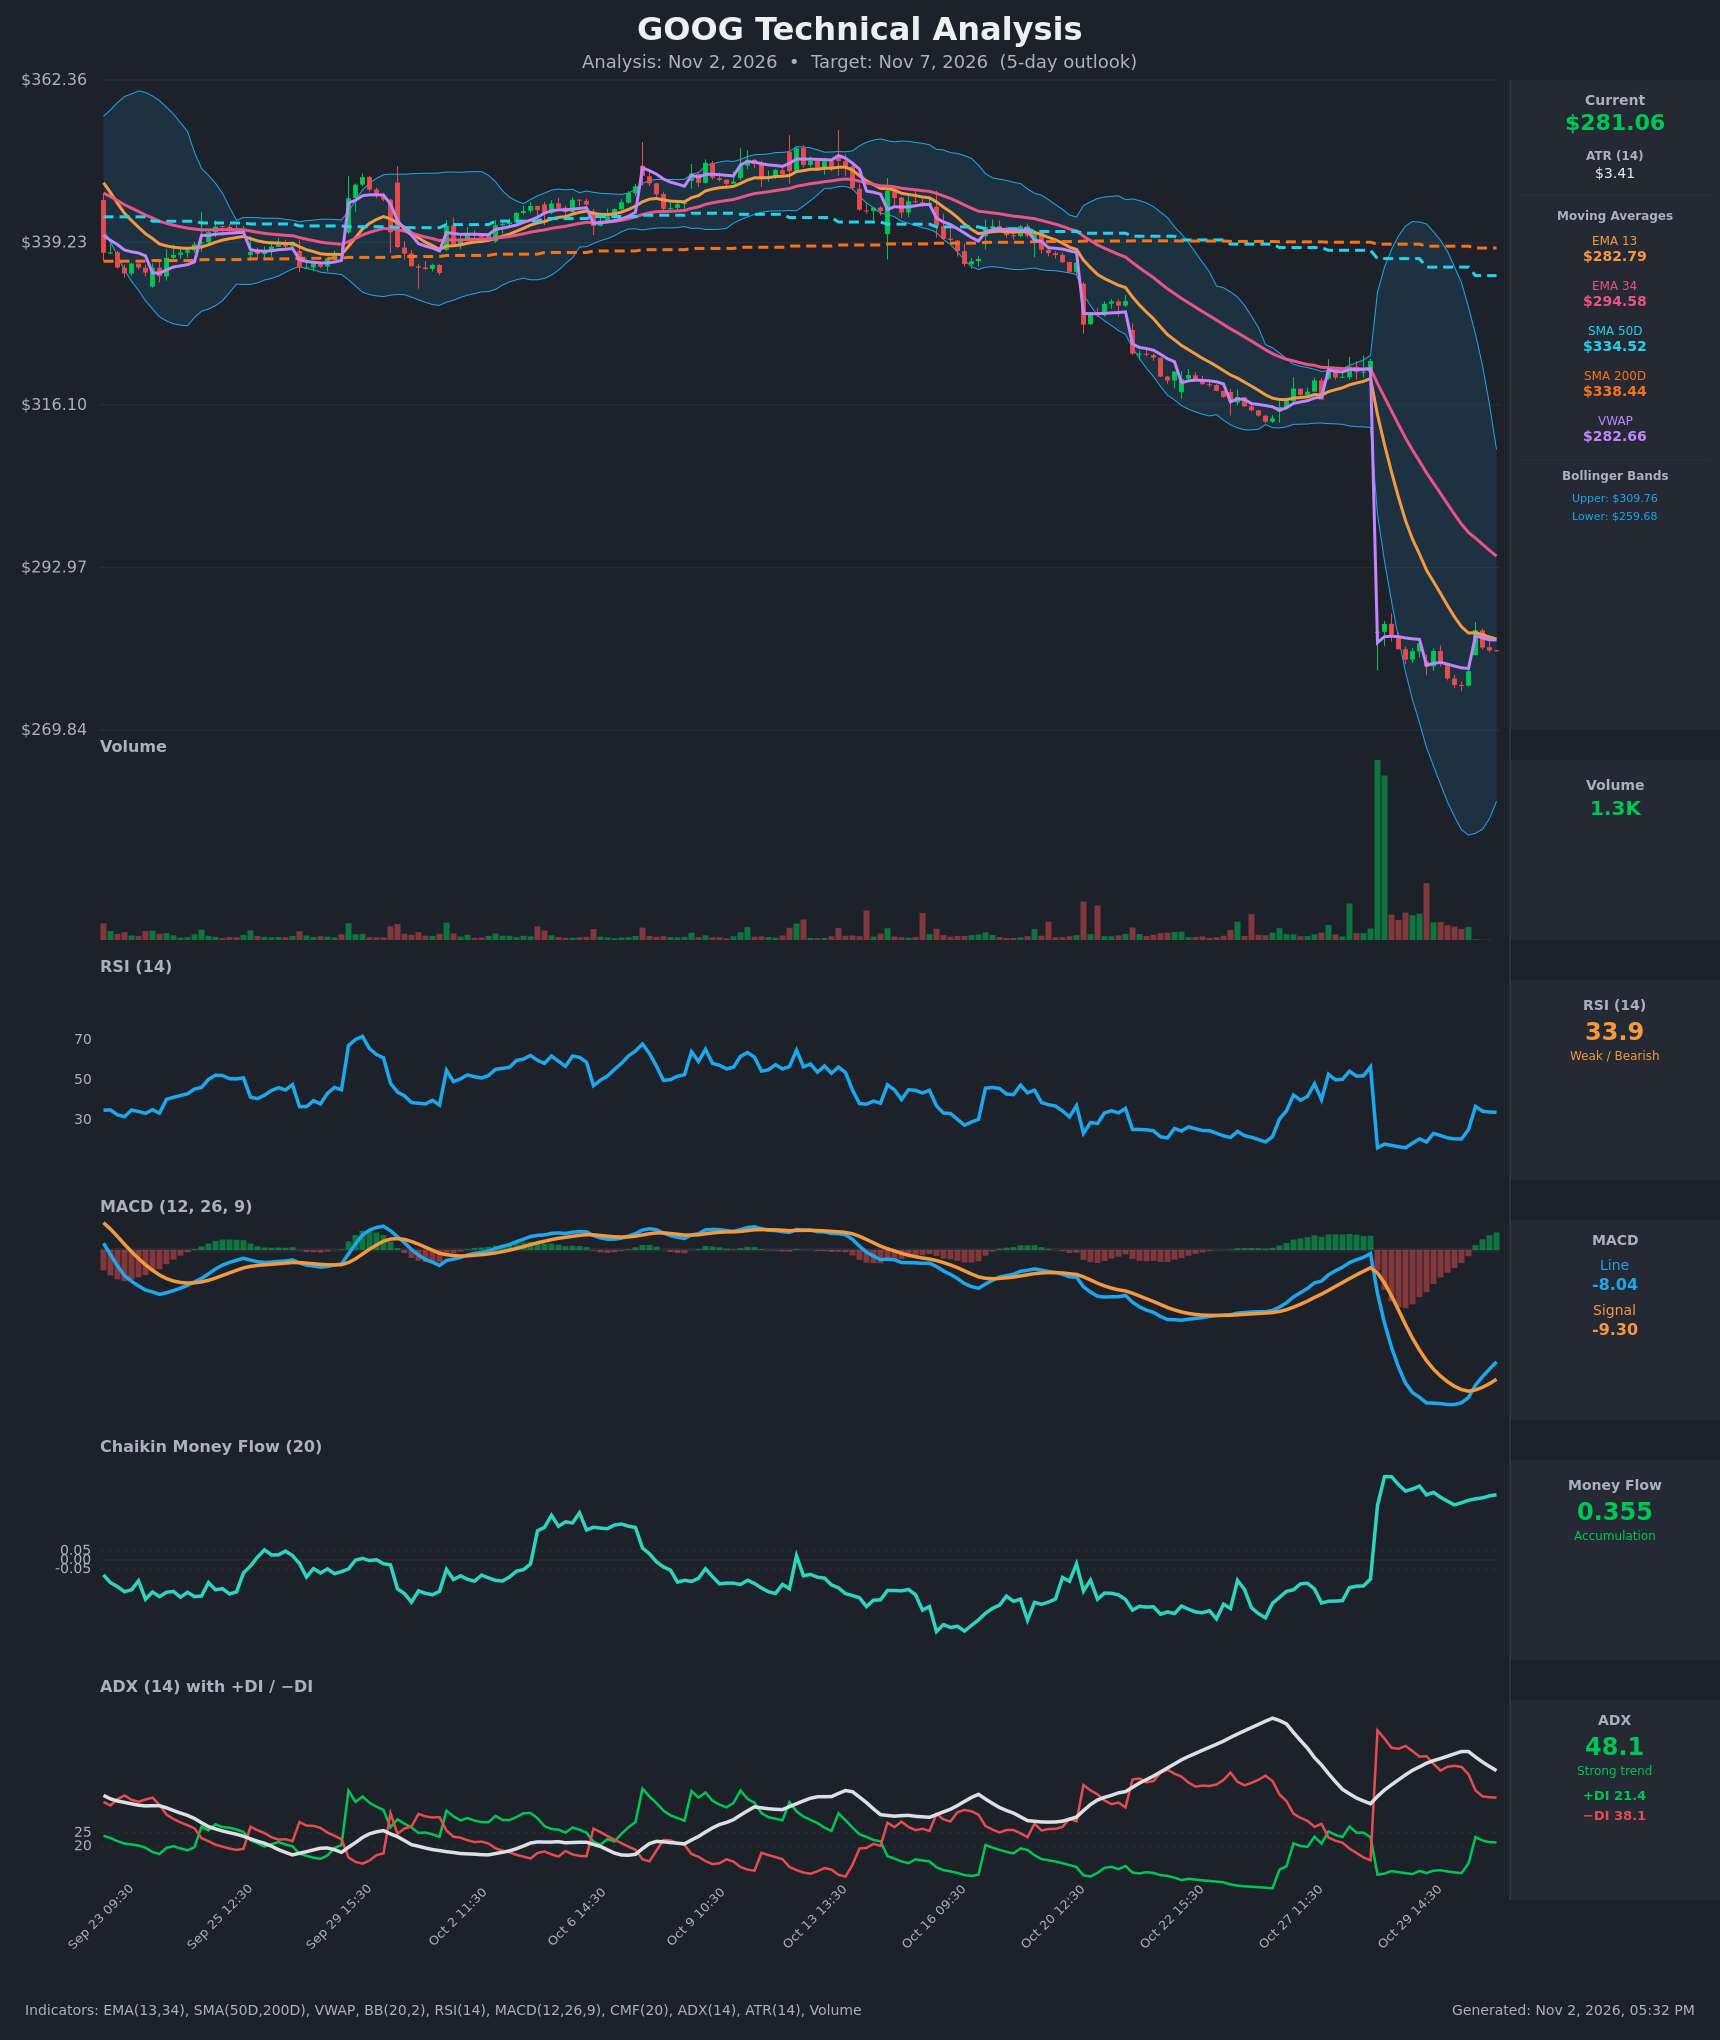
- RSI (14): 33.86, recovering from an extreme low of about 16 on Oct 29. It has stabilized in the low-to-mid 30s and is still below 50 and near oversold. The trend is improving but not yet bullish. [Neutral]
- 20 EMA (EMA 13/34 used): EMA13 is $282.79 and price ($281.06) sits just under it. EMA34 is $294.58, well above, and EMA13 is far below EMA34, so the bearish cross is intact. EMA13 is flattening as price stabilizes, but it is overhead resistance. [Bearish]
- MACD: The line (-8.04) has crossed above the signal (-9.30), a bullish crossover that began Nov 2. The histogram is positive and rising, but both lines are deeply negative. This is a relief-bounce signal, not a trend reversal. [Bullish]
- Bollinger Bands (20): Upper is $309.76 and lower is $259.68, so the bands are very wide after the gap-down. Price is in the lower half, slightly below the midline (about $284.7), and well off the lower band. Volatility is likely to contract, which fits consolidation or a bounce toward the midline. [Neutral]
- CMF (20): 0.355, far above +0.05. It spiked on the gap-down volume and has held since, which suggests absorption or buying at the lows. The reading is probably inflated by the gap-volume spike. [Accumulation]
- ADX (14): 48.1, a strong trend, but it is rolling over from about 55 and the trend is losing steam. −DI (38.1) is still above +DI (21.4), though −DI has fallen from 57 and +DI has risen from 10. [Strong Trend – Bearish, fading]
- Volume: 1.3K, very light compared with the huge gap-day spike. Volume has faded steadily since, and the recent small green candles show no heavy selling. That suggests selling exhaustion, though there is no strong buying confirmation either. [Neutral / selling exhaustion]
Other context:
- VWAP: $282.66, just above price, which is mild resistance.
- SMA50D/SMA200D: $334.52 and $338.44. The SMA50 is below the SMA200 (death cross in place), and price is about 17% below both, so the long-term trend is down.
DIVERGENCES & TRENDS
- Bullish momentum divergence: Price made a new low around Oct 30 (about $276) while RSI and MACD have turned up. RSI rose from about 16 to the mid-30s, and the MACD histogram flipped positive.
- DI convergence: −DI is falling and +DI is rising. A +DI/−DI crossover has not happened yet, so bears still control the trend. A falling ADX with a falling −DI points to a weakening downtrend.
- MA structure: Death cross in place, EMA13 below EMA34, and price below all long-term averages. This is still a bearish structure.
- CMF: Sustained positive since the gap, in contrast to the price collapse. This is a bullish divergence, though possibly distorted by the gap candle.
- Price vs VWAP/EMA13: Price is oscillating around the $282.7 cluster, which is the immediate decision point.
CHART PATTERNS
- Post-gap consolidation (Bearish Pennant/Flag-like): After a vertical gap-down, price has formed a tight sideways base between roughly $272 and $284. Per the reference diagram, a bearish pennant or flag would break down, measuring the pole to give a target well below $270. The consolidation is tight and on fading volume, which fits this pattern.
- Possible Bullish Falling Wedge/base: Lows are not being made on momentum, with RSI and MACD turning up. A break above $284 to $285 would show a base forming and open a gap-fill move toward the EMA34 (about $294.58).
- Significance: The pattern is unresolved. The bearish continuation target is lower than the bullish bounce target, but momentum divergences and CMF favor a mean-reversion bounce over the next 5 days.
POTENTIAL SCENARIOS
- Scenario 1: Bullish Relief Bounce Toward the EMA34 — Oversold conditions, the MACD bullish cross and positive CMF drive a rebound through the EMA13/VWAP cluster. Trigger: hourly close above $284.50 (post-gap high and EMA13/VWAP). Target: $290 to $294.58 (the EMA34 and the Bollinger midline area). Invalidation: close below $274. (45% probability)
- Scenario 2: Bearish Continuation (Pennant Breakdown) — Sellers defend the EMA13/VWAP resistance, −DI re-accelerates and price breaks the consolidation low. Trigger: break below $276 to $272. Target: $265 to $260 (the lower Bollinger Band). Invalidation: close above $285. (33% probability)
- Scenario 3: Neutral Range-Bound Digestion — Price chops between $274 and $286 while volatility contracts and ADX decays. Trigger: failure to break either side. Target: $278 to $284. Invalidation: a decisive close outside $272 to $287. (22% probability)
PRICE TARGETS
- Target Price: $286.50 (5-day)
- Expected Range: $274.00 to $294.00 (width $20, about 7.1% of the current price, consistent with the 5-day guidance of 4 to 8%)
- Key Levels: Support at $272.50 (recent swing low), Resistance at $294.58 (EMA34). Minor hurdle at $282.7 to $284 (EMA13/VWAP/post-gap high).
OVERALL BIAS
OVERALL BIAS: BULLISH - Oversold RSI recovering from about 16, a bullish MACD crossover with a positive histogram, strong CMF accumulation, and fading volume and ADX suggest a relief bounce. This is a counter-trend move inside a bearish structure, so conviction is modest and the EMA13/VWAP cluster at about $283 must be reclaimed.
This is educational analysis and not financial advice.