LQD 5-day bullish forecast — Nov 2, 2026
- Bias: Bullish
- Timeframe: 5 days (made Nov 2, 2026, target date Nov 6, 2026)
- Price at analysis: $104.22
- Price target: $104.55
- Expected range: $102.90 – $106.00
- Result: Correct (+0.3%) — closed at $104.53 on Nov 6, 2026; quality score 100/100
Get a free AI analysis of LQD today
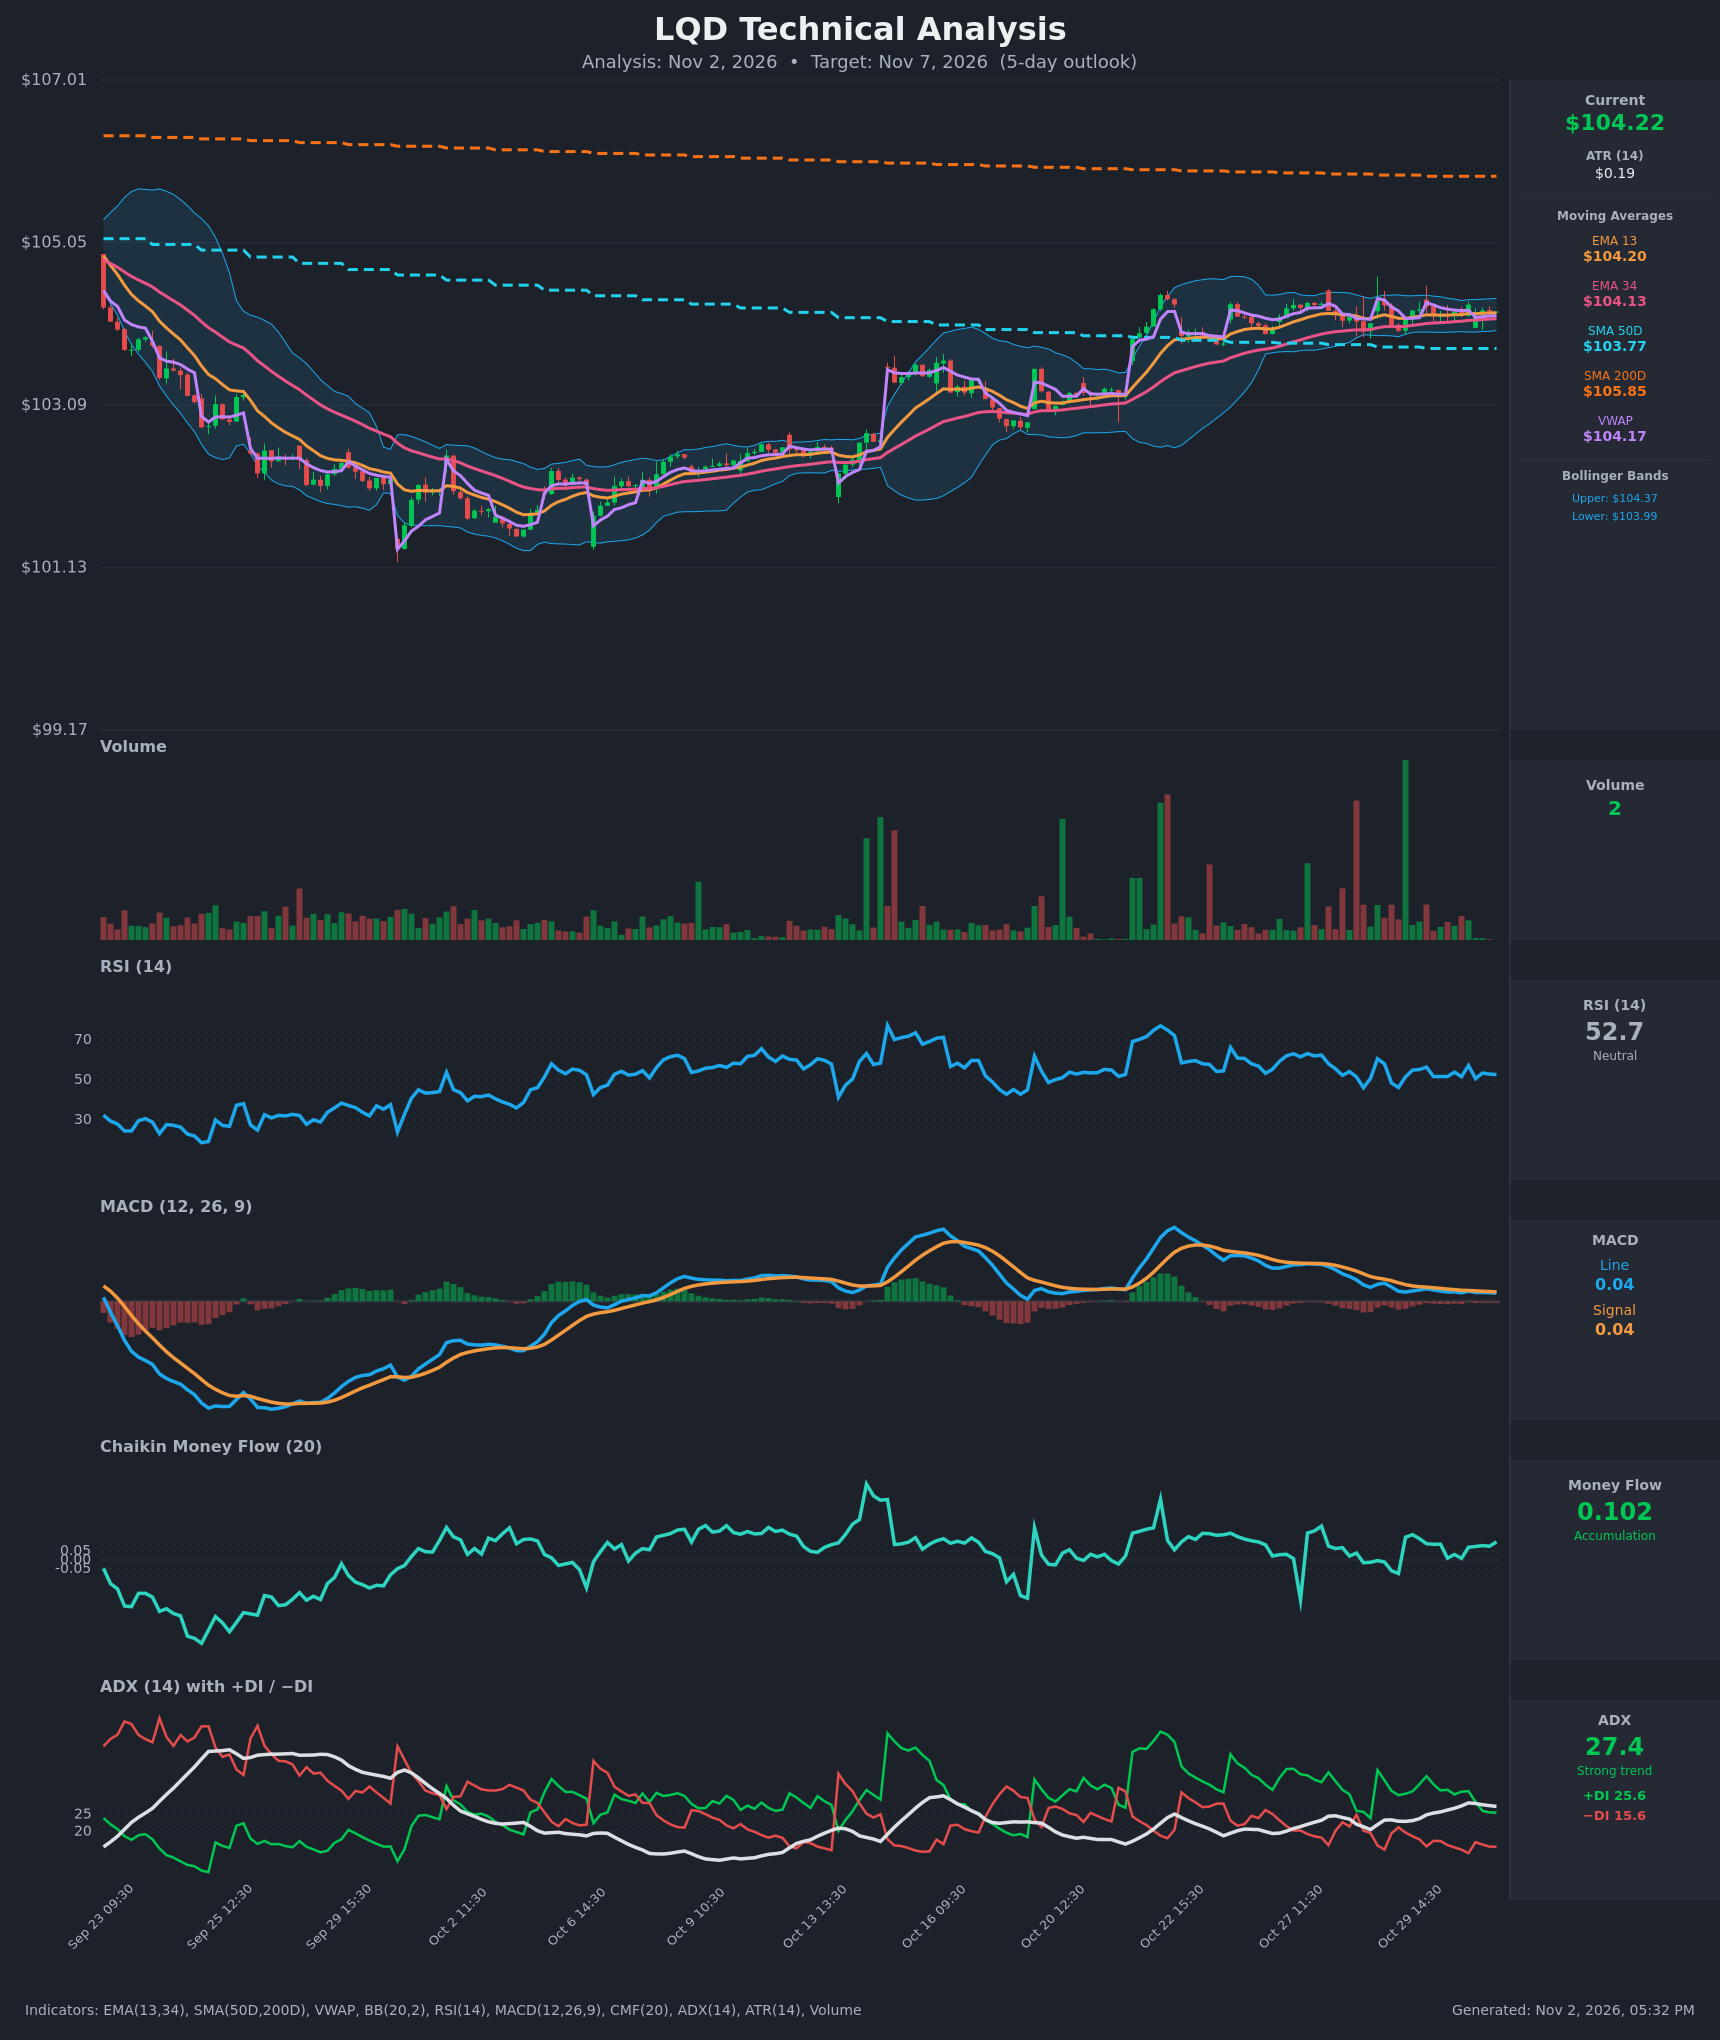
Analysis
TECHNICAL INDICATORS
- RSI (14): 52.70, near the midline. It has oscillated between about 50 and 57 over the last 15 bars, with no overbought or oversold reading and no clear directional momentum. [Neutral]
- 20 EMA (EMA 13 / EMA 34 used): EMA 13 is $104.20 and EMA 34 is $104.13. Price at $104.215 sits just above both, and EMA 13 has been above EMA 34 throughout the recent bars. The gap is only about $0.07, so support is shallow but intact. [Bullish]
- MACD: Line 0.0355 is below Signal 0.0411, a histogram of about -0.006. The line has been below the signal since Oct 29 and both are drifting toward zero, a fading-momentum consolidation rather than a strong bearish impulse. [Bearish]
- Bollinger Bands (20): Upper $104.37, lower $103.99, so the bands are very narrow (about $0.39, under 0.4% of price). Price is in the upper-middle of the bands. This is a volatility squeeze that often precedes a breakout, with no directional bias on its own. [Neutral]
- CMF (20): 0.102, above the +0.05 threshold and positive for most of the recent bars, which points to steady accumulation. [Accumulation]
- ADX (14): 27.4 with +DI 25.6 and −DI 15.6. The trend is strong and bulls are on top. However, +DI has fallen from 36 to 25.6 and ADX is edging down from 28.4, so the trend is cooling into the sideways drift. [Strong Trend, Bullish direction]
- Volume: Reads 2, and recent bars are light compared with the Oct 22 breakout and the Oct 27–29 spikes. Contracting volume during a tight range is typical of consolidation and awaits a catalyst. [Neutral / Consolidation]
Other levels:
- VWAP: $104.17, with price just above it. [Mildly Bullish]
- SMA 50D: $103.77, below price and rising. [Bullish]
- SMA 200D: $105.85, far above price and sloping down. LQD is still in a long-term downtrend/death-cross regime, which caps rallies. [Bearish]
DIVERGENCES & TRENDS
- There is no meaningful price/RSI divergence. Price has moved sideways at $104.1–$104.3 while RSI has held around 50–57.
- MACD has been decaying from the Oct 22–23 peak, and DI spread and ADX are slowly compressing. This reflects momentum cooling as price consolidates, not a bearish divergence.
- CMF has stayed positive despite the flat price, a mild bullish divergence in which buyers are quietly absorbing supply.
- EMA 13 is above EMA 34, and both are above the rising SMA 50D. There is no recent EMA crossover.
- SMA 50D is below SMA 200D, so there has been no golden cross. The gap of about $2 is slowly narrowing.
- MACD crossed below its signal on Oct 29, a minor bearish crossover that is still in effect.
CHART PATTERNS
- Since the Oct 22 breakout from about $103 to $104.3, price has formed a tight horizontal range at $104.0–$104.4. This resembles the Bullish Pennant / Flag Pattern from the reference, a continuation pattern after an impulsive advance. The narrow Bollinger Bands support a coiling structure.
- A bullish resolution implies a move to the upper band and then toward the $104.7–$105.0 area. The pattern's measured target is limited by the declining SMA 200D near $105.85.
- A failure would be a break below the range ($103.99 and the EMA 34 at $104.13), opening a retest of the SMA 50D around $103.77.
POTENTIAL SCENARIOS
- Scenario 1: Bullish Pennant Breakout — The tight consolidation resolves upward, helped by positive CMF and +DI dominance. Trigger: a close above the $104.37 upper band, ideally with rising volume. Target: $104.55–$105.00. Invalidation: a close below $103.99. (50% probability)
- Scenario 2: Neutral Range Persistence — Price keeps chopping around $104.0–$104.4 as momentum fades and MACD stays flat, ending the week near the current level. Trigger: no break of the band edges. Target: $104.10–$104.35. Invalidation: a decisive close outside $103.95–$104.45. (30% probability)
- Scenario 3: Bearish Range Breakdown — Weak MACD and the long-term downtrend below the SMA 200D pull price lower. Trigger: a close below $104.13 and then $103.99. Target: $103.50–$103.77 (SMA 50D). Invalidation: a reclaim of $104.30. (20% probability)
PRICE TARGETS
- Target Price: $104.55 (5-day horizon)
- Expected Range: $102.90 to $106.00 (width $3.10, about 3.0% of current price. This is wider than a 2–3 day range and sits at the low end of the 5-day scaling, because LQD is a low-volatility bond ETF with ATR of only $0.19.)
- Key Levels: Support at $103.99, Resistance at $104.37
OVERALL BIAS
OVERALL BIAS: BULLISH - Price is above the rising EMAs, SMA 50D and VWAP. CMF shows accumulation, +DI dominates, and the tight Bollinger squeeze looks like a bullish pennant. The bearish MACD and the overhead SMA 200D at $105.85 limit conviction and the upside.
This is educational analysis and not financial advice.