HIMS 5-day bearish forecast — Nov 2, 2026
- Bias: Bearish
- Timeframe: 5 days (made Nov 2, 2026, target date Nov 6, 2026)
- Price at analysis: $27.73
- Price target: $27.35
- Expected range: $26.40 – $28.50
- Result: Correct (-6.1%) — closed at $26.03 on Nov 6, 2026; quality score 71/100
Get a free AI analysis of HIMS today
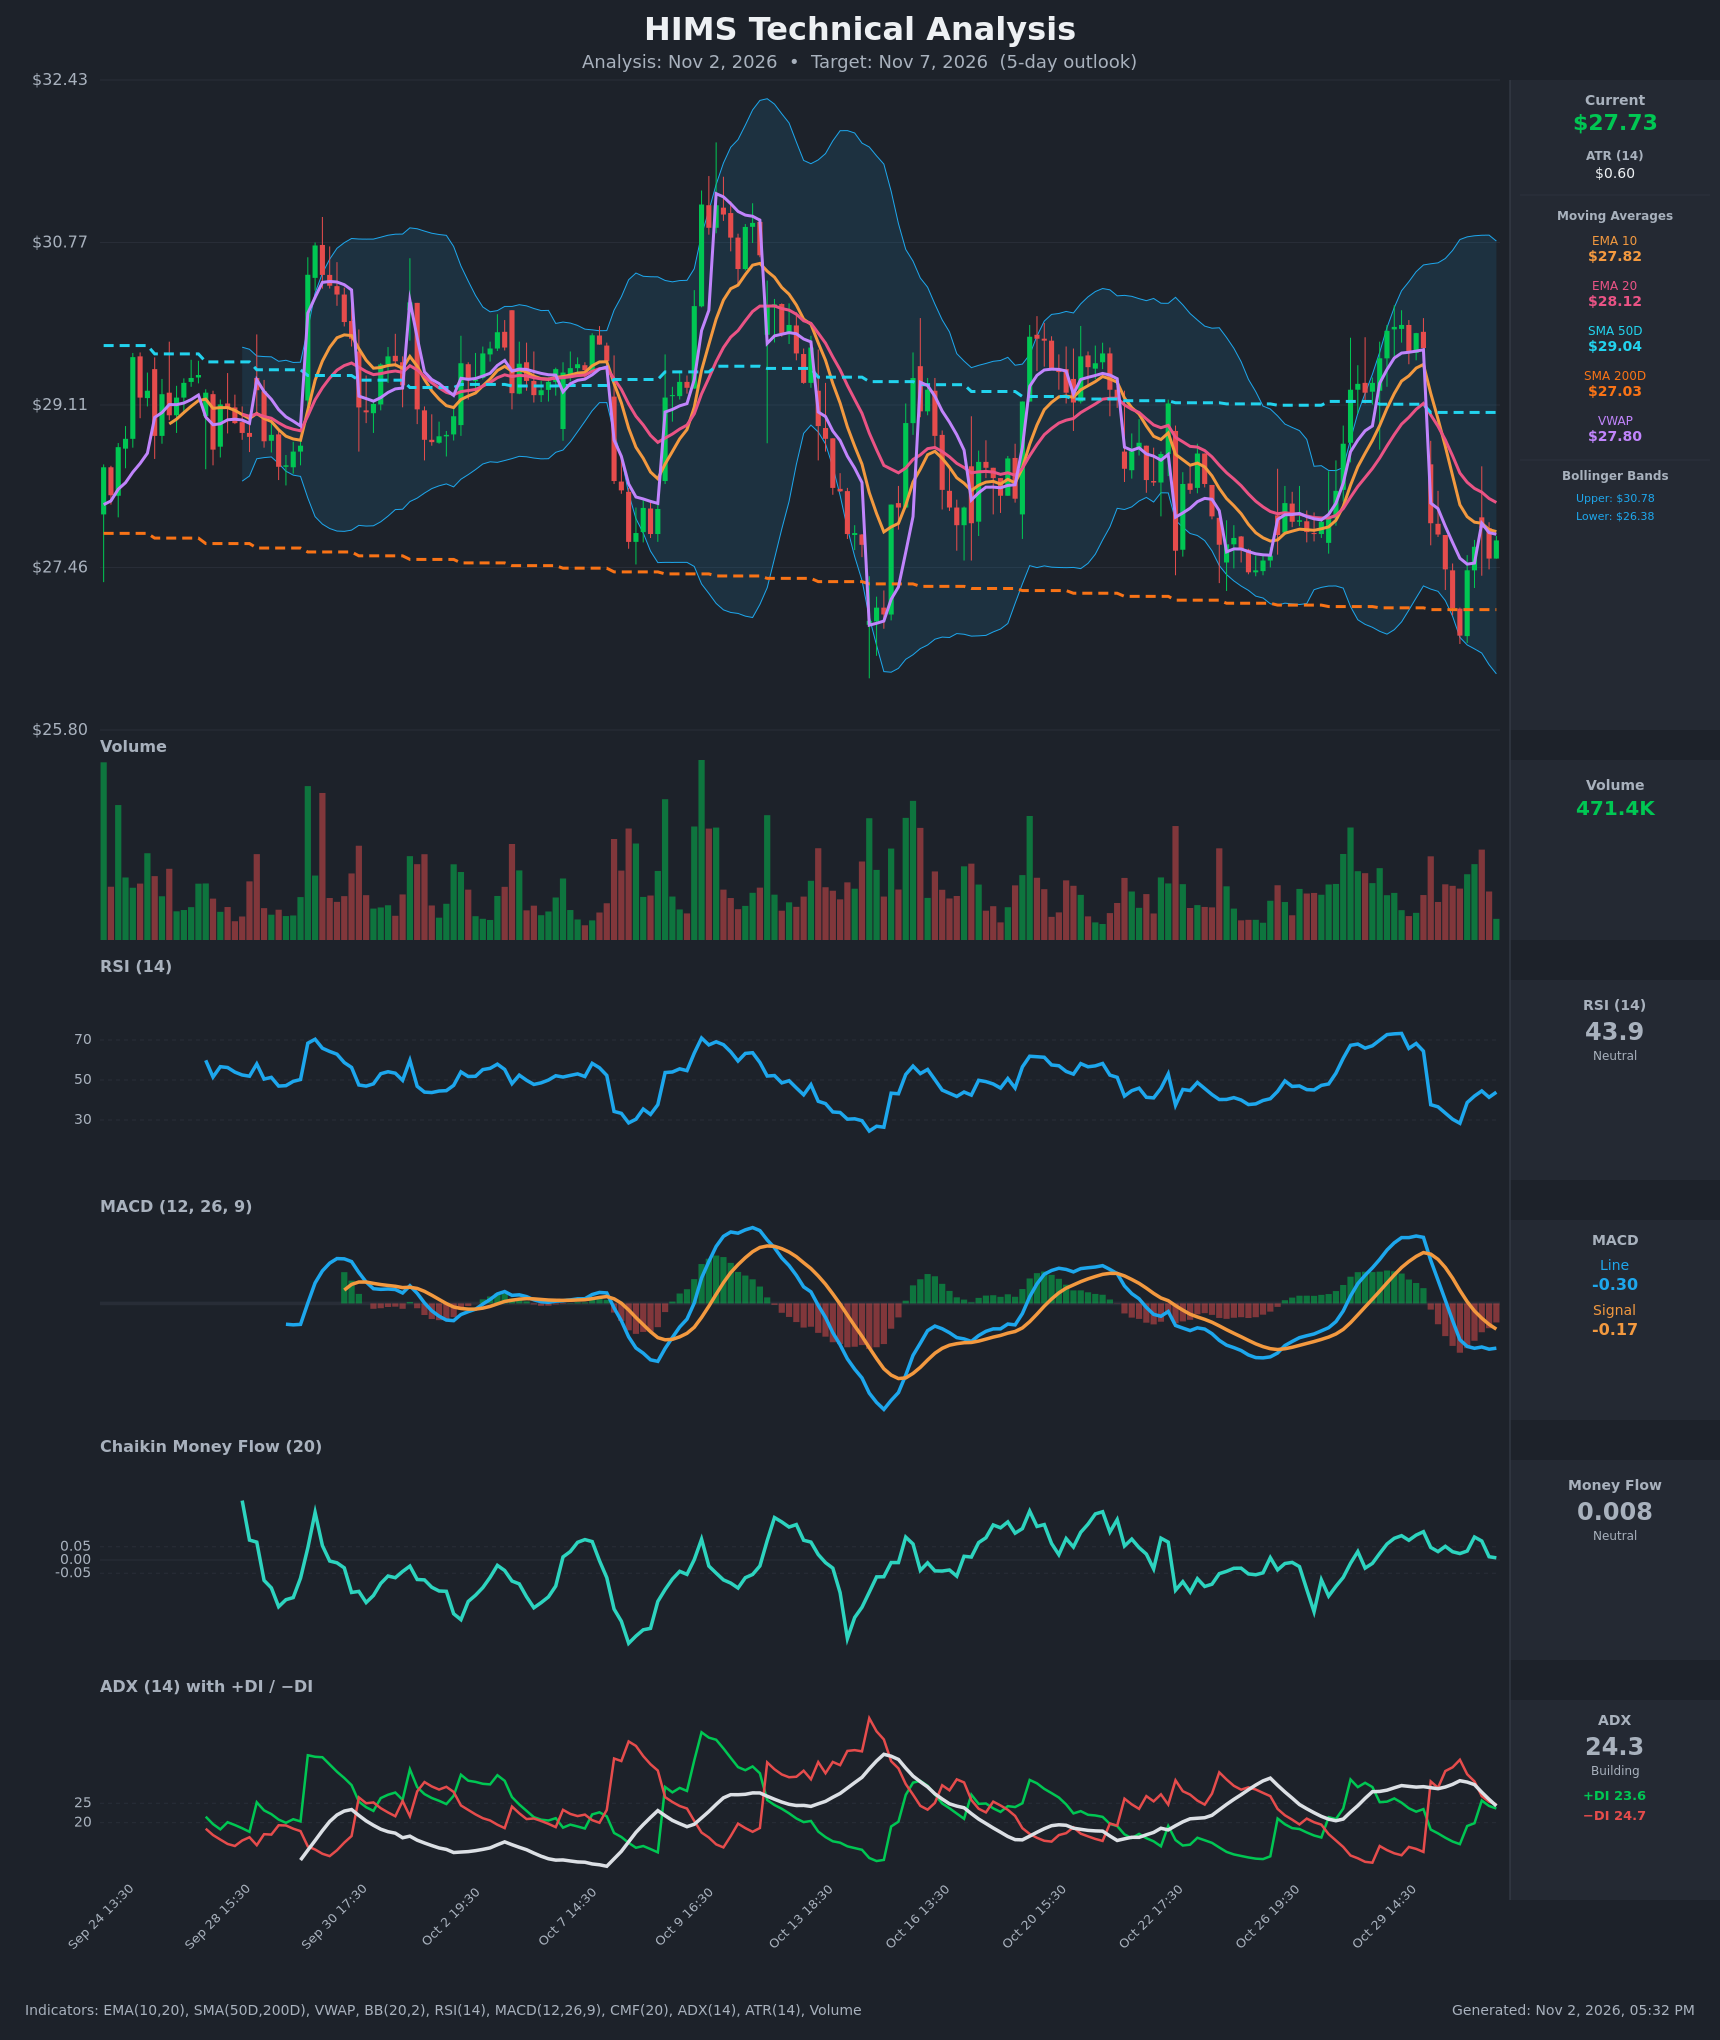
Analysis
TECHNICAL INDICATORS
- RSI (14): 43.90. It fell from 73 on Oct 29 to a low of about 28 on Oct 30, then recovered to the low 40s. It remains below 50, so momentum is still soft, but it is no longer oversold. [Bearish]
- 20 EMA: $28.12, with EMA10 at $27.82. Price at $27.735 is below both, and EMA10 sits below EMA20 after a bearish cross on Oct 30. The EMAs are sloping down and act as overhead resistance. Price is also below the SMA50D ($29.04) and just above the SMA200D ($27.03). [Bearish]
- MACD: Line -0.301 is below signal -0.173, so the histogram is -0.128. The bearish cross happened on Oct 30. The histogram has narrowed over the last four bars (from about -0.25 to -0.13) because the MACD line is flat, which hints at momentum stabilizing. It is still a bearish configuration. [Bearish]
- Bollinger Bands (20): Upper $30.78, lower $26.38, with price at $27.735 in the lower half of the bands, about 31% of the way from the lower band. The bands are wide after the volatile swing. The Oct 30 low of $26.77 stayed above the lower band, and price has since bounced back toward the midline. [Neutral]
- CMF (20): 0.008, inside the ±0.05 neutral zone and drifting down from about 0.09–0.10. There is no clear accumulation or distribution. [Neutral]
- ADX (14): 24.3 and falling from about 30, with +DI 23.6 and −DI 24.7. The bearish trend that began on Oct 30 is fading and the DIs have nearly converged. −DI is only marginally on top. This points to a weakening trend and a possible range. [Weak Trend, slight bearish tilt]
- Volume: 471.4K on the latest bar, which is average to slightly below average. The bounce off the $26.77 low came on modest volume, so buyers are not showing strong conviction. VWAP is $27.80, and price just below it is slightly negative. [Neutral to mildly bearish]
DIVERGENCES & TRENDS
- No clear divergence. The $26.77 low came with RSI near 28, and the recent higher price (about $27.7) has RSI in the low 40s, which is consistent rather than divergent.
- Bearish crosses: EMA10 crossed below EMA20 and MACD crossed below signal on Oct 30. The DI cross to −DI > +DI came at the same time and is only just being tested again.
- Fading trend: ADX has fallen from about 30 to 24.3 and the DIs are converging. The selloff is losing steam and price is stabilizing, which favors a base or a weak bounce rather than a fresh collapse.
- Long-term trend: There is no golden or death cross, since SMA50D ($29.04) is above SMA200D ($27.03). Price sits between them, so the SMA200D is the key support and the SMA50D the key resistance.
- Structure: The gap down from about $29.7 to about $27.9 on Oct 30 was followed by lower highs. The bounce is capped by the EMA stack and VWAP around $27.80–$28.12.
CHART PATTERNS
- Bearish flag or pennant (weak match): After the sharp drop, the small stabilizing bounce under falling EMAs resembles a bearish flag or pennant. A break below $27.03–$26.77 would target about $26.0 and slightly below.
- Wider range: On the broader view, price has traded roughly between $26.4 and $30.7 for weeks, with the SMA200D area acting as a floor. This is consistent with a broad range rather than a clean reversal pattern.
- No convincing bullish reversal yet: A double bottom would need price to reclaim $28.1–$28.3 first.
POTENTIAL SCENARIOS
- Scenario 1: Bearish Rejection at EMA Resistance — The bounce stalls under the EMA20 and VWAP, and the bearish MACD and EMA alignment pull price back toward the SMA200D. Trigger: rejection near $28.10–$28.30 or a hourly close below $27.40. Target: $27.00 to $26.60. Invalidation: a close above $28.30 (EMA20 reclaimed). (45% probability)
- Scenario 2: Bullish Relief Bounce — The oversold RSI recovery and the narrowing MACD histogram extend, with +DI crossing above −DI. Trigger: a push above $28.12 on rising volume. Target: $28.80 to $29.04 (SMA50D). Invalidation: a break below $27.03. (33% probability)
- Scenario 3: Neutral Chop Above the SMA200D — Price oscillates between $27.0 and $28.2 as ADX continues to fade. Trigger: weak, mixed volume with price near VWAP. Target: $27.50 to $27.90. Invalidation: a close outside $26.8–$28.4. (22% probability)
PRICE TARGETS
- Target Price: $27.35 (5-day horizon)
- Expected Range: $26.40 to $28.50 (width $2.10, about 7.6% of current price, consistent with the 7-10 day band scaled to 5 days)
- Key Levels: Support at $27.03 (SMA200D), Resistance at $28.12 (EMA20)
OVERALL BIAS
OVERALL BIAS: BEARISH - Price is below the EMA10, EMA20, SMA50D and VWAP, MACD is below its signal after a bearish cross, and −DI is marginally above +DI. The fading ADX and the SMA200D just below limit downside, so the expected drift is modest.
This is educational analysis and not financial advice.