XLP 5-day bullish forecast — Nov 2, 2026
- Bias: Bullish
- Timeframe: 5 days (made Nov 2, 2026, target date Nov 6, 2026)
- Price at analysis: $90.31
- Price target: $90.85
- Expected range: $88.60 – $92.30
- Result: Correct (-0.3%) — closed at $90.07 on Nov 6, 2026; quality score 100/100
Get a free AI analysis of XLP today
Analysis
TECHNICAL INDICATORS
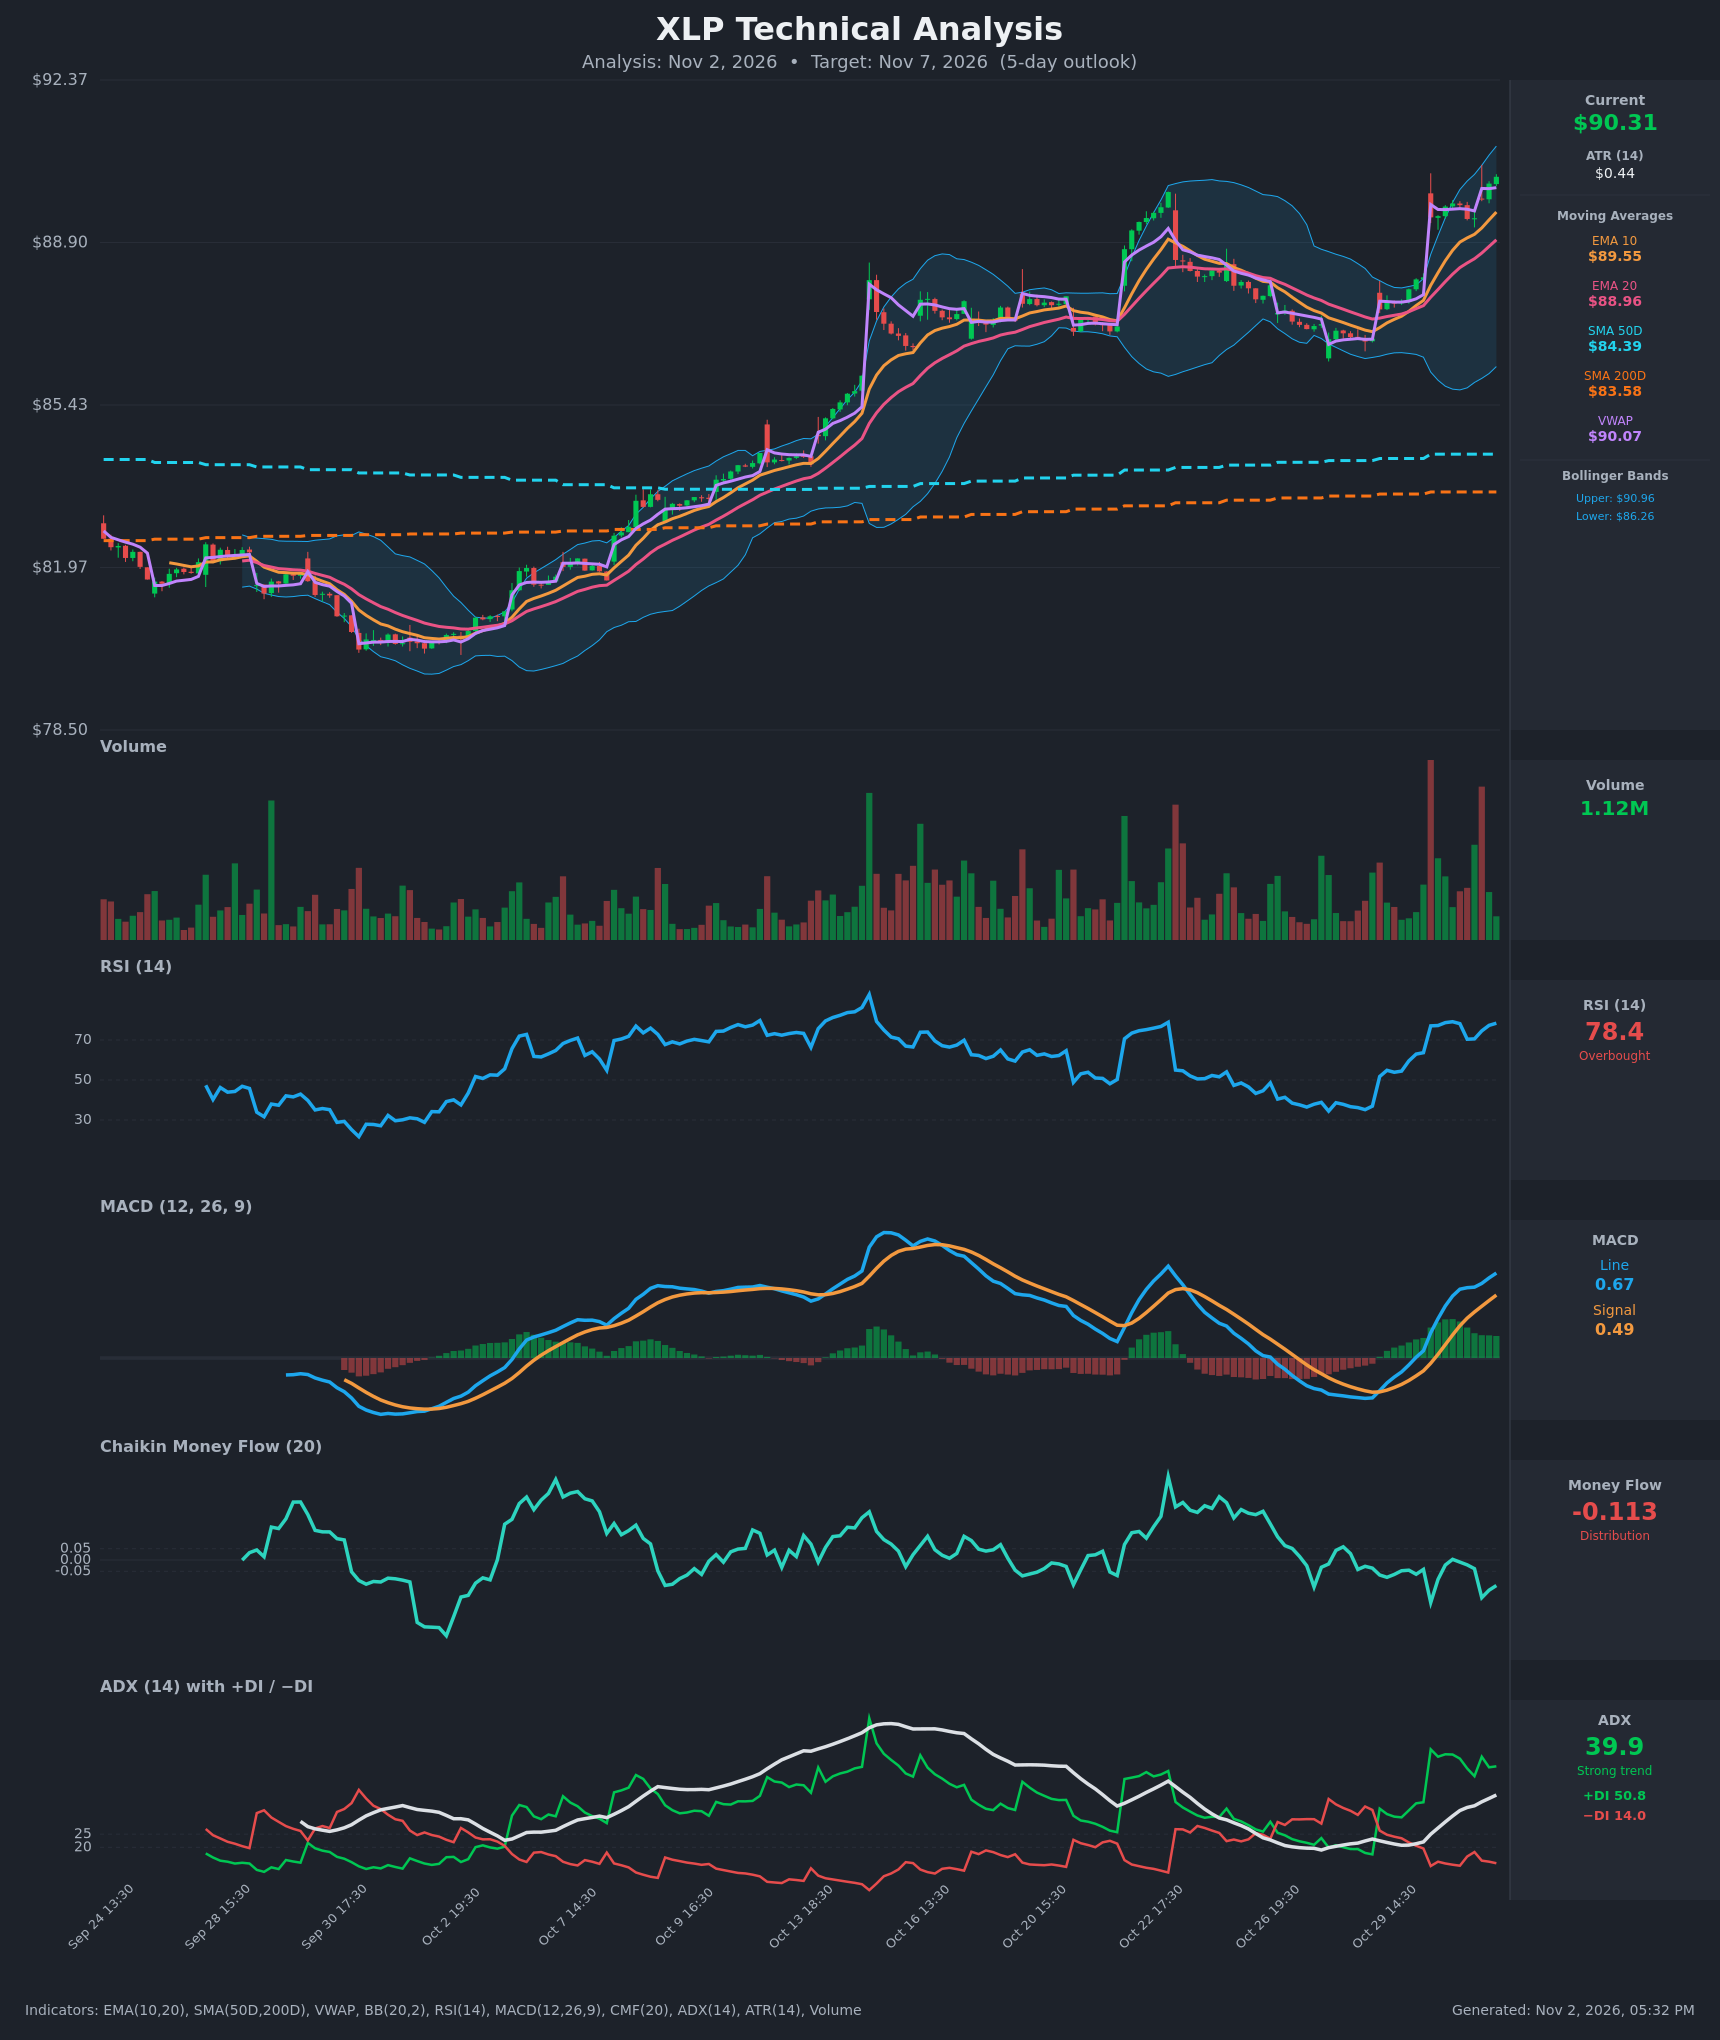
- RSI (14): 78.41, in overbought territory (>70). It has held at 70-79 since the Oct 30 gap-up, and the last two readings (78.4 and 77.3) are climbing again after a dip to 70.4. This matches the Oct 16 peak near 80, which was followed by a pullback. Momentum is strong but stretched. [Neutral]
- 20 EMA: $88.96, with price about 1.5% above it. EMA10 ($89.55) is above EMA20, and both are rising and fanned out. Price is above both, so they act as dynamic support, with the nearest at $89.55. [Bullish]
- MACD: Line 0.666 is above signal 0.493, and the histogram is positive (+0.17) and expanding. The bullish crossover came on Oct 30 and the gap is still widening. The line is still below the Oct 16 high, so there is room to run. [Bullish]
- Bollinger Bands (20): Upper $90.96, lower $86.26, mid about $88.61. Price at $90.31 sits in the upper band, about $0.65 below the upper band, with the bands expanding upward. This shows trend "walking the band" behavior, though it is extended versus the mid-band. [Bullish]
- CMF (20): -0.113, below -0.05 and persistently negative through the whole advance. The rally is not backed by buying pressure, which is a warning sign. [Distribution]
- ADX (14): 39.9 and rising, with +DI at 50.8 far above −DI at 14.0. This is a strong, accelerating uptrend with bulls firmly in control. Readings near 40 can start to plateau, so watch for exhaustion. [Strong Trend + Bullish]
- Volume: 1.12M, moderate and unremarkable on the last bar. The heaviest volume appeared on the Oct 30 gap-up and the sell-off bars. Price is above VWAP ($90.07), a mild positive. Volume is not confirming the move with fresh expansion. [Neutral to slightly Bearish]
DIVERGENCES & TRENDS
- CMF vs price: Price is making new highs ($90.31) while CMF is negative (-0.113) and well below its Oct 22 peak. This is a bearish divergence between money flow and price, and it suggests the rally is fragile.
- RSI: There is no clear divergence. Current RSI of 78.4 is slightly below the Oct 30 peak of 79.1 while price is higher, which is a very minor negative.
- Trend alignment: Price is above EMA10, EMA20, SMA50 ($84.39) and SMA200 ($83.58). The golden cross has already occurred (SMA50 above SMA200), and price is about 8% above SMA200. This is a firmly established uptrend.
- MACD: The bullish crossover is intact and the histogram is expanding. This is the strongest momentum evidence.
- DI: +DI is dominant and ADX is rising, with no sign of trend weakening yet.
- Gap-driven staircase: The advance has come in gap-ups (Oct 13-16, Oct 30) followed by sideways digestion. The pattern is one of strong buying at the open and then fading.
CHART PATTERNS
- Bullish continuation (flag/ascending-triangle-like): After the Oct 30 gap-up, price consolidated tightly at $89.40-$89.80, then broke out above $89.8 on Nov 2. This resembles the Bullish Flag Pattern or Ascending Triangle from the reference. The measured move is roughly the gap height of about $1.7-2.0, which points to $91.5-$92.0.
- Caution, rising-wedge risk: The longer-term series of higher highs on narrowing momentum is a loose Bearish Rising Wedge risk. It is not confirmed, because there is no break below the lower trendline or EMA10 at $89.55.
- Prior analog: The Oct 16 top (RSI about 80) was followed by a roughly 2-3% pullback.
POTENTIAL SCENARIOS
- Scenario 1: Bullish Trend Continuation — The strong ADX/+DI trend and expanding MACD histogram carry price above the upper Bollinger Band as the flag breakout unfolds, with the market riding the band higher. Trigger: hourly close above $90.96 (upper BB). Target: $91.50-$92.20. Invalidation: close below $89.55 (EMA10). (50% probability)
- Scenario 2: Bearish Overbought Pullback — RSI above 78 and negative CMF lead to profit-taking, as happened after the Oct 16 peak. Price retraces to EMA10/EMA20 support. Trigger: rejection at $90.96 and a hourly close below $89.55. Target: $88.90-$89.40. Invalidation: reclaim of $90.96 on volume. (35% probability)
- Scenario 3: Neutral Consolidation — Price digests the gain just below the upper band and chops between $89.6 and $90.9. Trigger: failure to break either $90.96 or $89.55. Target: $90.00-$90.60. Invalidation: a close outside the $89.55-$90.96 band. (15% probability)
PRICE TARGETS
- Target Price: $90.85 (5-day horizon)
- Expected Range: $88.60 to $92.30 (width $3.70, about 4.1% of current price, appropriate for 5 days)
- Key Levels: Support at $89.55 (EMA10, with $88.96 EMA20 below it), Resistance at $90.96 (upper Bollinger Band, with $92.00 above)
OVERALL BIAS
OVERALL BIAS: BULLISH - A strong, accelerating trend (ADX 39.9, +DI 50.8 vs −DI 14.0), a widening bullish MACD crossover, and price above all key moving averages and VWAP favor modest continuation. Overbought RSI (78.4) and negative CMF (-0.113) keep conviction moderate and raise pullback risk toward $89.55.
This is educational analysis and not financial advice.