CRCL 19-day bearish forecast — Nov 2, 2026
- Bias: Bearish
- Timeframe: 19 days (made Nov 2, 2026, target date Nov 20, 2026)
- Price at analysis: $72.54
- Price target: $69.50
- Expected range: $65.50 – $74.00
- Result: Pending — graded after the close on Nov 20, 2026
Get a free AI analysis of CRCL today
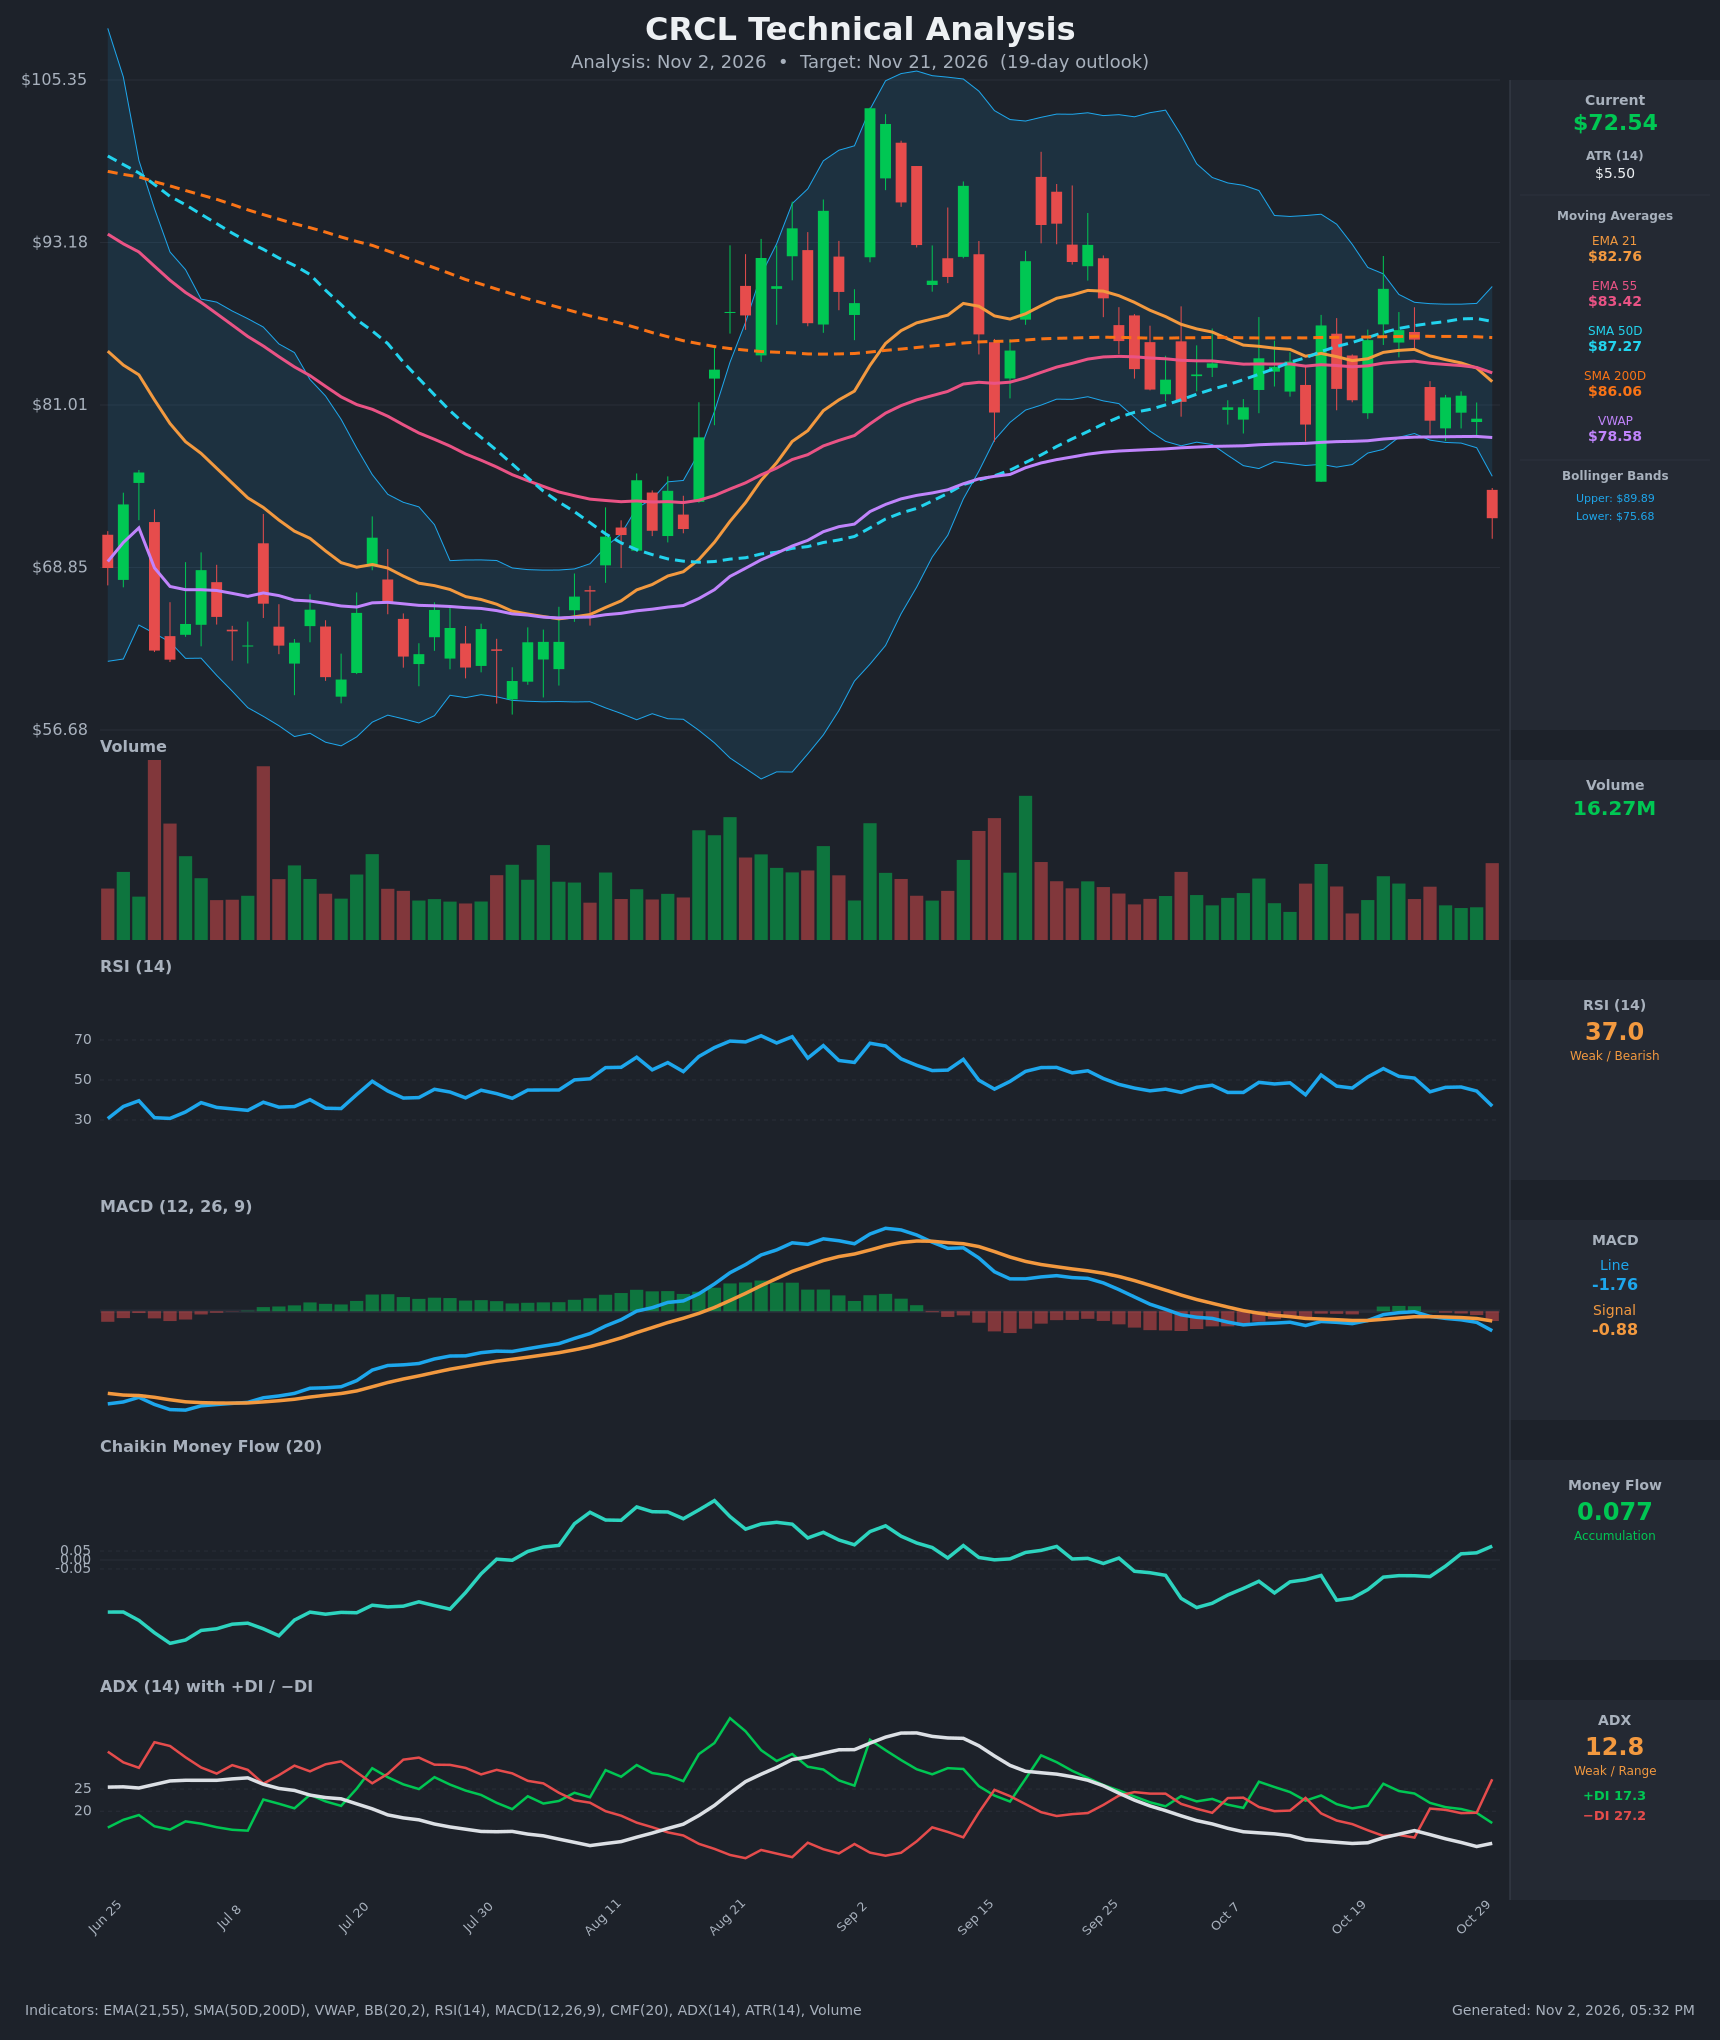
Analysis
TECHNICAL INDICATORS
- RSI (14): 36.95, down from 44.5 the prior day and from 55.7 on Oct 21. Momentum is falling and approaching oversold (<30) but not there yet, so there is room to fall further. [Bearish]
- 20 EMA: The 21 EMA is $82.76 and price at $72.54 is about 12% below it. The EMA is rolling over and below the EMA55 ($83.42), a bearish cross that just occurred. It now acts as overhead resistance. [Bearish]
- MACD: Line -1.76 is below signal -0.88, widening from -1.00 vs -0.66 the day before. The line crossed below the signal on Oct 26. The histogram is negative and expanding, so downside momentum is accelerating. [Bearish]
- Bollinger Bands (20): Upper $89.89, lower $75.68. Price closed about $3.14 below the lower band, a volatility-expansion breakdown after the bands had been narrowing. This is a bearish breakout, but it is also stretched enough to invite a snap-back toward the band. [Bearish]
- CMF (20): 0.077, above the +0.05 threshold and rising since Oct 28. This is mild accumulation, but the reading lags the sharp one-day drop and may fade quickly if selling volume persists. [Accumulation]
- ADX (14): 12.8, with −DI (27.2) well above +DI (17.3). The trend is weak, but the DI spread widened sharply on the breakdown day and bears have clear control. A move in ADX above 20 would confirm a new downtrend. [Weak Trend, Bearish Direction]
- Volume: 16.27M on a large red candle. It is above the recent quiet-day average (~10M) and the largest red bar since the Sep-Oct selloffs, which suggests real selling rather than a low-volume dip. [Bearish – Distribution Day]
DIVERGENCES & TRENDS
- CMF vs price: CMF has risen from -0.22 to +0.077 while price made lower lows, a mild bullish divergence. It is unconfirmed, because the latest bar's volume is bearish and CMF is likely to roll over.
- MACD vs price: There is no divergence. MACD is making new lows with price, which confirms the downside momentum.
- Moving averages: Price is below EMA21, EMA55, SMA50D ($87.27), SMA200D ($86.06) and VWAP ($78.58). SMA50D remains above SMA200D, so the golden cross is intact, but SMA50D has flattened and is starting to roll over. EMA21 crossed below EMA55 on Oct 29.
- RSI: It has made a series of lower highs since the Oct 21 peak.
- ADX: It sits at a low 12.8. The break from a range at low ADX often begins a trend leg, and the DI crossover is bearish.
CHART PATTERNS
- Range breakdown (resembles a Bearish Triple Top / distribution): From September to late October, price was capped at $87–90 and held a $79–90 range with repeated failures near the highs. The Oct 30 gap-down breaks the range floor.
- Target: The measured move of the ~$11 range height from the ~$79 breakdown level projects to about $68, which lines up with the $68.85 prior consolidation zone from August.
- Bullish counter-case: There is no confirmed reversal pattern. A bounce would need a reclaim of $75.68 (the lower band), which would turn the move into a false-breakdown bear trap.
POTENTIAL SCENARIOS
- Scenario 1: Bearish Range-Breakdown Continuation — Price follows through on the breakdown, with a possible small relief bounce that fails at the lower Bollinger Band or $75–76. The measured move and prior support are at $68–69, with a possible overshoot toward $65. Trigger: close below $71.50 or failure to reclaim $75.68. Target: $68.85, then $65. Invalidation: daily close above $78.58 (VWAP). (50% probability)
- Scenario 2: Bullish Oversold Mean-Reversion Bounce — The 9% one-day flush, the close below the lower band and CMF accumulation trigger a snap-back toward the band and VWAP. Trigger: reclaim of $75.68 on rising volume. Target: $78.58 (VWAP), then $82.76 (EMA21). Invalidation: close below $68.85. (35% probability)
- Scenario 3: Neutral Basing Chop — Price stabilizes between support and the lower band while ADX stays weak. Trigger: several inside days on falling volume. Target: $68.85–$75.68 range. Invalidation: close outside either boundary. (15% probability)
PRICE TARGETS
Range width check: $74.00 − $65.50 = $8.50, which is 11.7% of the $72.54 current price. This fits the 14–21 day guide (8–12%).
- Target Price: $69.50 (19-day horizon)
- Expected Range: $65.50 to $74.00
- Key Levels: Support at $68.85, Resistance at $75.68
OVERALL BIAS
OVERALL BIAS: BEARISH - Price broke below the Bollinger lower band and all key moving averages on above-average volume. MACD crossed bearish, −DI now dominates, and the measured move from the broken $79–90 range points to ~$68–69. The oversold bounce risk and rising CMF are why conviction is moderate.
This is educational analysis and not financial advice.