CIEN 27-day bearish forecast — Nov 3, 2026
- Bias: Bearish
- Timeframe: 27 days (made Nov 3, 2026, target date Nov 30, 2026)
- Price at analysis: $301.52
- Price target: $288.00
- Expected range: $268.00 – $322.00
- Result: Pending — graded after the close on Nov 30, 2026
Get a free AI analysis of CIEN today
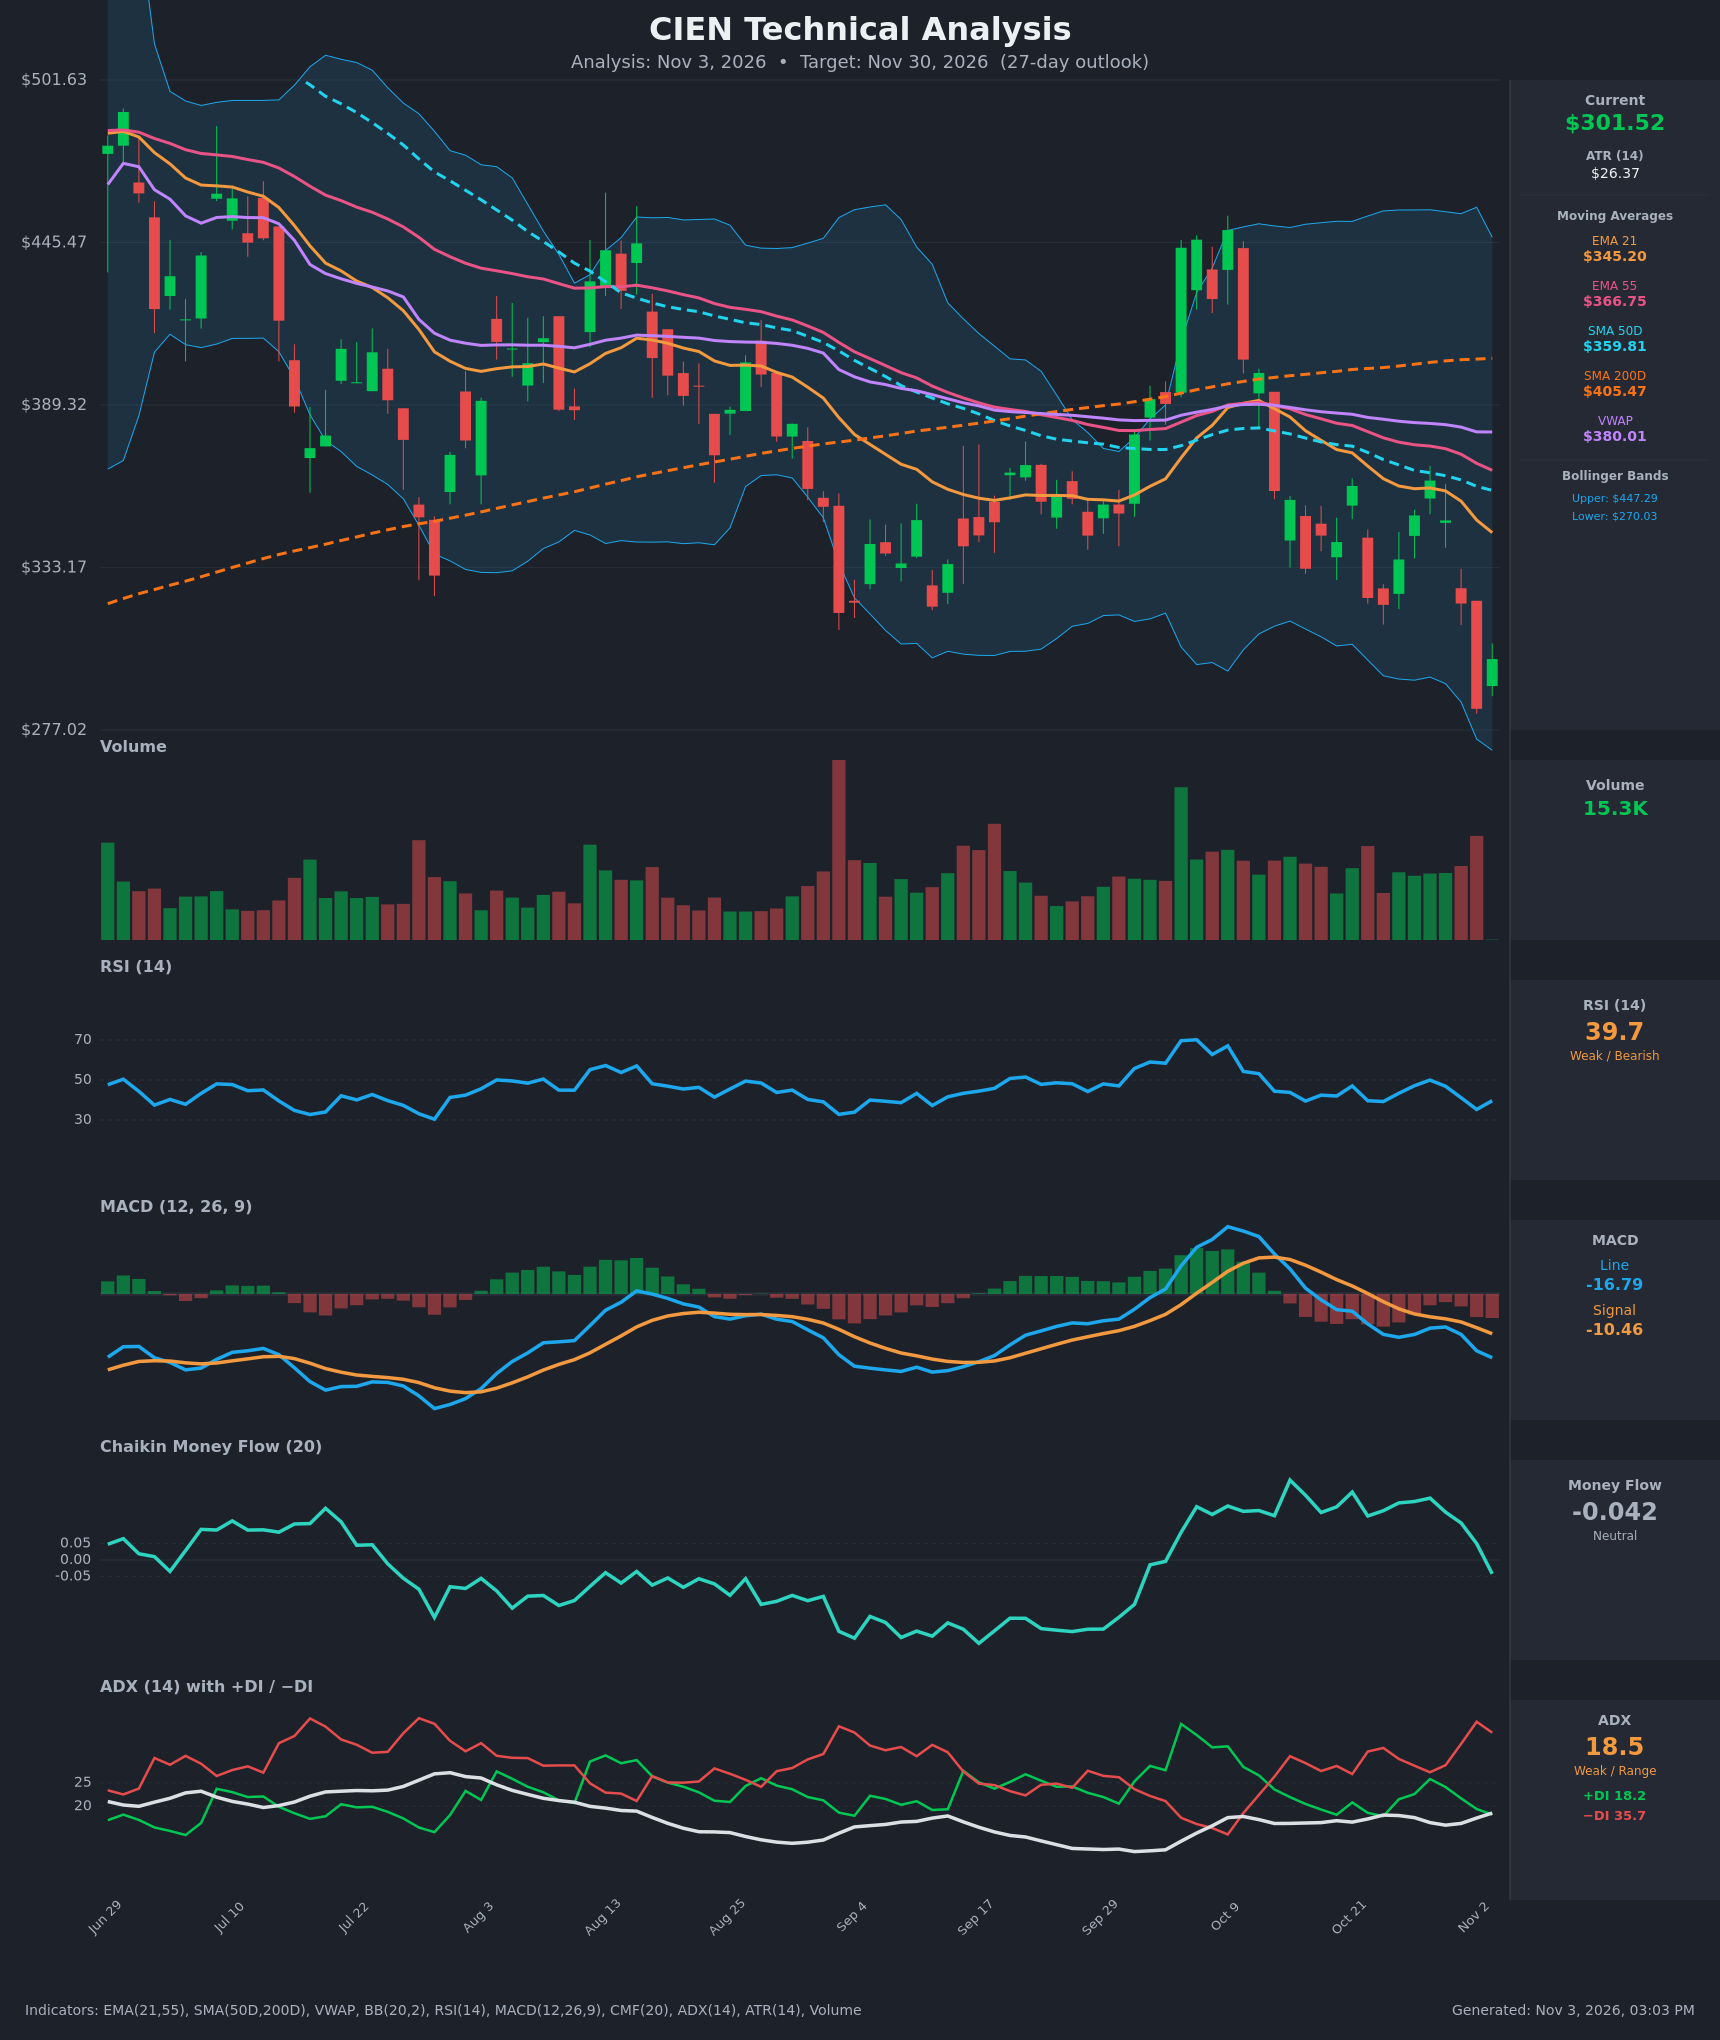
Analysis
TECHNICAL INDICATORS
- RSI (14): 39.66, down from the 47-50 area in late October and bouncing off 35.3 on Nov 2. It is weak but not oversold (<30), so there is room for more downside. [Bearish]
- 20 EMA (EMA 21): $345.20, with price about 12.6% below it. The EMA is falling and sits below EMA 55 ($366.75), so it acts as overhead resistance. [Bearish]
- MACD: Line -16.79 is below Signal -10.46, with a widening negative histogram. The bearish crossover happened around Oct 22-23 and the gap is still expanding. [Bearish]
- Bollinger Bands (20): Upper $447.29, lower $270.03, so the bands are very wide. Price is in the lower third, about 17% above the lower band. It touched the lower band area on Nov 2 and bounced, which could give a relief rally. The wide bands reflect high volatility, not a squeeze. [Neutral]
- CMF (20): -0.042, down from +0.13 to +0.24 in mid-October. The reading is technically neutral (between ±0.05), but it is falling quickly and has just turned negative. Buying pressure has faded. [Neutral]
- ADX (14): 18.5 and rising from 16, with −DI 35.7 well above +DI 18.2. The trend is not yet strong, but the directional bias is clearly bearish and the DI spread is wide. [Weak Trend, bearish direction]
- Volume: 15.3K, with the Nov 2 breakdown candle on elevated volume. The Nov 3 bounce is small-bodied and does not show convincing volume expansion. Selling volume has been heavier than buying volume on the recent drops. [Mildly Bearish]
- Other moving averages / VWAP: Price is below SMA50D ($359.81), SMA200D ($405.47) and VWAP ($380.01). SMA50D is below SMA200D, so the long-term structure is bearish. [Bearish]
DIVERGENCES & TRENDS
- There is no clear bullish RSI divergence. RSI at 39.7 versus price at a new multi-month low is consistent, not divergent. The RSI low of 35.3 is higher than the late-July low near 30, but price is also at lower levels, so this is a minor observation.
- The MACD momentum peak in early October (roughly +10 on the Oct 14 data) has rolled over into a steady decline. Both lines are below zero and MACD is still below its signal.
- CMF dropped from strongly positive (about +0.24) to just below zero within three weeks. That is a clear deterioration in money flow.
- The −DI crossed above +DI around Oct 14-15 and has widened to a 17.5-point spread.
- EMA21 is below EMA55, and both are well below SMA200D, which is still rising slowly (about $405). The stack is bearishly aligned.
- The Nov 3 green candle after a 12% drop on Nov 2 is a dead-cat-bounce candidate. It is still below the Oct 30 close of $320.72, and RSI at 39.7 has not confirmed a reversal.
CHART PATTERNS
- Range breakdown, bearish rectangle/continuation: From early September through October, price chopped between roughly $320 and $365 (plus a spike to about $445 in early October that failed). Price has now broken below the ~$320 floor. This resembles a bearish range/triple-top-style structure from the reference diagram. The measured move is about $45 below $320, near $275, which is also close to the lower Bollinger Band ($270).
- Failed breakout: The early-October spike toward $445 reversed fully, which is a bull trap. The move that followed erased the gain.
- Bearish flag potential: If the current bounce stalls under $320-$335, it would form a bearish flag/pennant, with a downside projection to the high-$260s.
- Resistance zones: $320-$323 (broken support), then the $335-$345 area (EMA21 and the Oct 16/Oct 22 gaps).
POTENTIAL SCENARIOS
- Scenario 1: Bearish Trend Continuation — The relief bounce fades below the broken $320 support and EMA21 ($345). −DI stays dominant and MACD keeps falling, driving price back to the lower Bollinger Band zone and the measured-move target. Trigger: rejection at $320-$335 or a close below $284.34. Target: $270-$285. Invalidation: daily close above $345 (EMA21). (50% probability)
- Scenario 2: Neutral Choppy Basing — After the sharp flush, price stabilizes between the Nov 2 low (~$277-$284) and ~$335 as RSI resets near 40 and volatility contracts. Trigger: holds above $284 for several sessions with low-volume drift. Target: $295-$325. Invalidation: close below $277 or above $345. (25% probability)
- Scenario 3: Bullish Oversold Mean Reversion — The Nov 2 low marks capitulation, price bounces back toward the falling EMA21/SMA50D zone. Trigger: close above $335 with improving volume and a MACD histogram turning up. Target: $345-$360. Invalidation: close below $284. (25% probability)
PRICE TARGETS
- Target Price: $288.00 (27-day, Nov 30, 2026)
- Expected Range: $268.00 to $322.00 (width $54, about 17.9% of the current price, consistent with the 30-60 day guidance of 12-18%)
- Key Levels: Support at $284.34, Resistance at $322.64
OVERALL BIAS
OVERALL BIAS: BEARISH - Price is below every moving average and VWAP, −DI dominates (35.7 vs 18.2), MACD is below its signal with a widening negative histogram, and CMF has rolled over. The range breakdown targets about $275. The bounce from the lower Bollinger Band and the lack of RSI oversold limit conviction, so the target is only modestly below the current price.
This is educational analysis and not financial advice.