OKTA 45-day bearish forecast — Nov 3, 2026
- Bias: Bearish
- Timeframe: 45 days (made Nov 3, 2026, target date Dec 18, 2026)
- Price at analysis: $185.65
- Price target: $175.00
- Expected range: $161.00 – $191.00
- Result: Pending — graded after the close on Dec 18, 2026
Get a free AI analysis of OKTA today
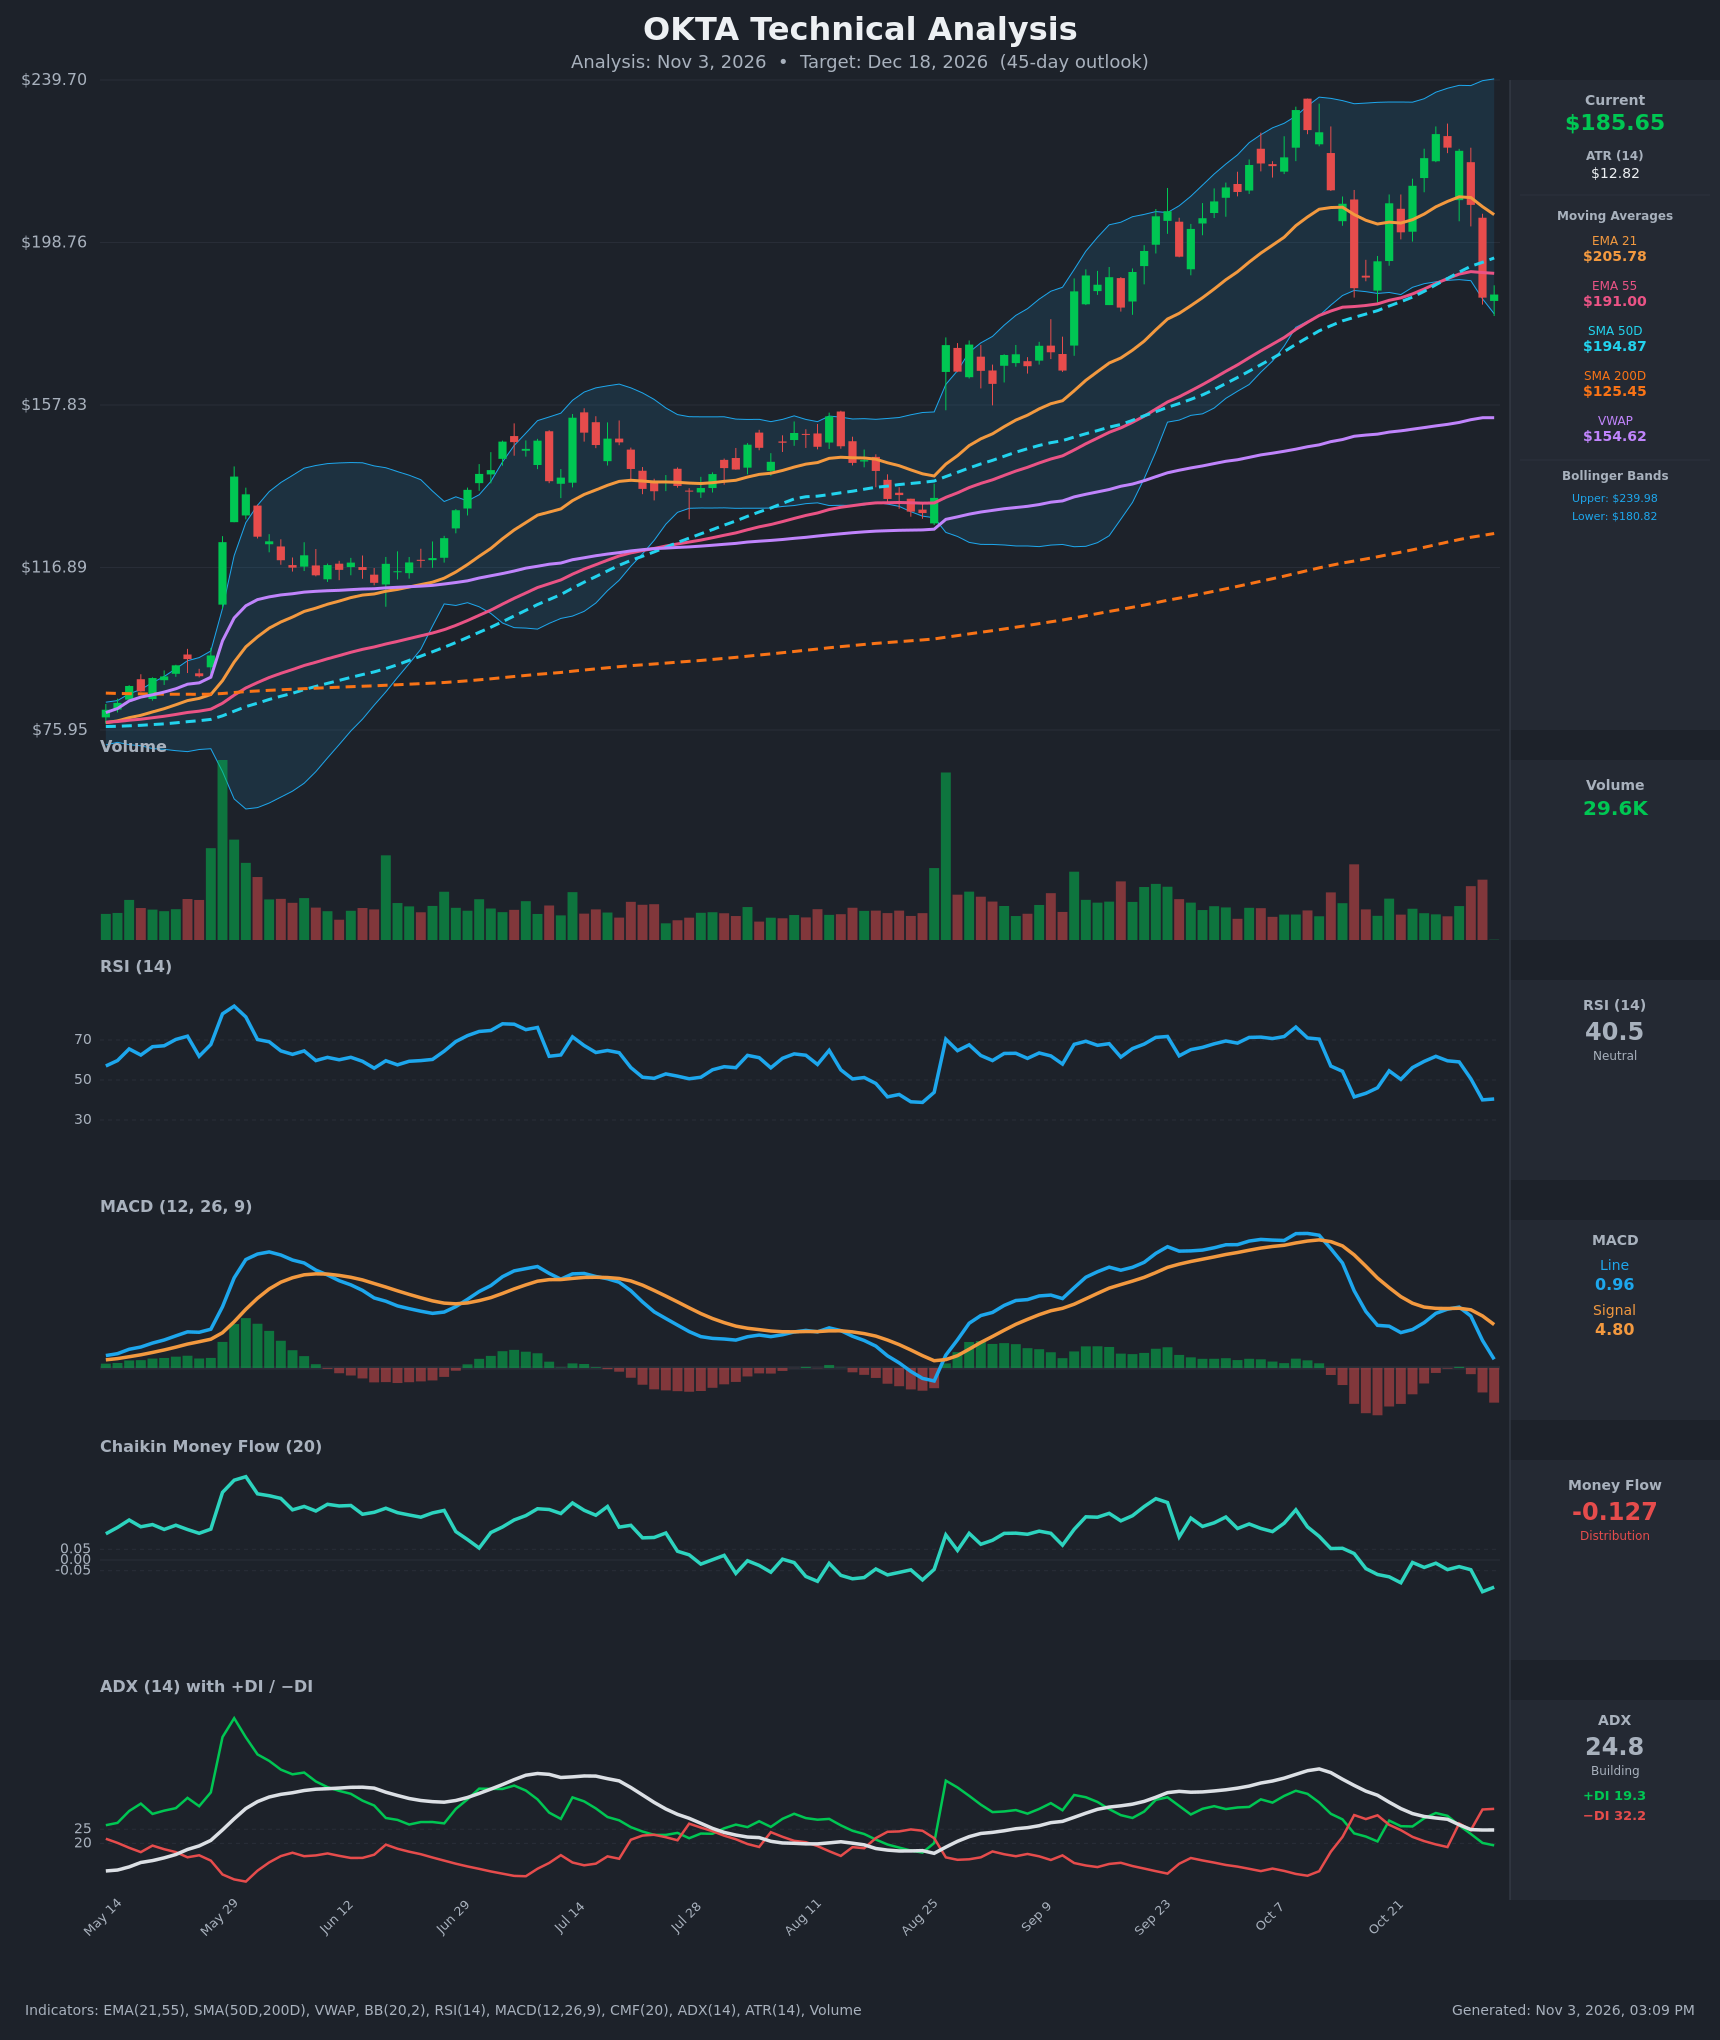
Analysis
TECHNICAL INDICATORS
- RSI (14): 40.51, down from 59 on Oct 28 and rolling over from the 50 line. It is not yet oversold (<30), so there is room to fall further. Momentum is clearly weakening. [Bearish]
- 20 EMA: The chart shows the EMA 21 at $205.78. Price at $185.65 is about 9.8% below it, so it acts as overhead resistance. The EMA 21 is also turning down (210.27 → 205.78) and sits well above the EMA 55. [Bearish]
- MACD: Line 0.96 is below Signal 4.80, with a growing negative histogram. The bearish crossover occurred around Oct 14 and the line has since collapsed from 13.2 to 0.96. It is approaching the zero line, and a break below zero would confirm a bearish momentum shift. [Bearish]
- Bollinger Bands (20): Upper $239.98, lower $180.82. Price is just above the lower band (about 8% of the band width from the bottom), following a sharp reversal from the upper half. It is a "walk down the band" risk, though a bounce from the lower band is also possible. The wide bands show elevated volatility. [Bearish]
- CMF (20): -0.127, below the -0.05 threshold and deteriorating from +0.05 on Oct 14-15. Selling pressure dominates and rallies to $226 were not accompanied by accumulation. [Distribution]
- ADX (14): 24.8, at the threshold and building. −DI at 32.2 is well above +DI at 19.3, a bearish DI crossover that occurred on Oct 29 and has widened since. Bears are in control with trend strength just under "strong." [Moderate Trend – Bearish]
- Volume: 29.6K is light on the latest bar, though the recent red candles (Oct 16, Oct 30, Nov 2) carried above-average volume. Distribution on sell-offs with a lighter bounce favors sellers. [Bearish-leaning]
- Other levels: Price is below the SMA 50 ($194.87) and EMA 55 ($191.00) but well above the SMA 200 ($125.45) and VWAP ($154.62). The long-term uptrend is intact, but the short-term structure has broken. There is no death cross, and the SMA 50 is still far above the SMA 200 (a golden cross happened earlier).
DIVERGENCES & TRENDS
- Price vs. RSI/MACD: The Oct 27 high at about $226 was a lower high than the early-Oct peak at about $232, and MACD (6.0 vs ~13) and RSI (61.8 vs ~75) made much lower highs. This is a clear bearish divergence, and it has now resolved to the downside.
- Moving averages: Price lost the EMA 21 (Oct 16 and again Oct 30) and has now closed below the EMA 55 and SMA 50. The EMA 21 is rolling over toward the EMA 55, so a bearish EMA cross could come within weeks.
- CMF trend: It fell from strongly positive in Aug/Sep to sustained negative since mid-Oct, confirming distribution.
- ADX/DI: −DI crossed above +DI on Oct 29, and the gap has widened to 13 points.
- MACD: The bearish signal-line cross has been in place for weeks, and the line is heading toward zero.
CHART PATTERNS
- Bearish Double Top (reversal): Peaks at about $232 (Oct 7) and about $226 (Oct 27) with a neckline in the roughly $178-$185 zone (Oct 16 and Nov 2 lows). Price is testing the neckline now. A decisive close below about $177 would confirm the pattern, with a full measured move (~$50 height) pointing toward about $130. That is likely too extreme for 45 days, but a partial move toward the $160s (the Aug 25 gap area) is plausible.
- Broader context: The earlier advance from $76 to $232 is a strong uptrend, so this could also be a correction within it. The SMA 200 (about $125) and the $157-$165 gap area are the major long-term supports.
- No bullish reversal pattern is visible yet.
POTENTIAL SCENARIOS
- Scenario 1: Bearish Neckline Breakdown — Price fails to reclaim the EMA 55/SMA 50 cluster and breaks the double-top neckline, with MACD going below zero and CMF staying negative. Trigger: daily close below $177. Target: $165-$175, with an extension toward $155-$160 (the gap zone). Invalidation: daily close above $195 (SMA 50). (50% probability)
- Scenario 2: Neutral Range/Base — Price finds support at the lower Bollinger Band and the $177-$181 zone, then chops between about $178 and $200 as the moving averages catch up. Trigger: holds $177 on a closing basis with RSI stabilizing near 35-40. Target: $180-$195. Invalidation: close below $177 or above $205. (20% probability)
- Scenario 3: Bullish Rebound — Dip buyers defend the uptrend, price reclaims the EMA 55/SMA 50 and then the EMA 21, and MACD turns up. Trigger: close above $195 with a CMF turn above 0. Target: $205-$215, retest of $226. Invalidation: loss of $177. (30% probability)
PRICE TARGETS
- Target Price: $175.00 (45 days, Dec 18, 2026)
- Expected Range: $161.00 to $191.00 (width $30, about 16.2% of current price, consistent with the 30-60 day guidance of 12-18%)
- Key Levels: Support at $177.00 (Oct 16 swing low; the lower Bollinger Band at $180.82 is the first minor support), Resistance at $191.00 (EMA 55; the SMA 50 at $194.87 is the next level above)
OVERALL BIAS
OVERALL BIAS: BEARISH - Price has broken below the EMA 21, EMA 55 and SMA 50. MACD is in a bearish cross, −DI is dominant, and CMF shows distribution. There is also a bearish divergence at the October highs and a possible double-top neckline test. The long-term uptrend (price above the SMA 200) limits the downside, so the target is a moderate pullback to about $175 rather than a full measured move.
This is educational analysis and not financial advice.