LITE 43-day bearish forecast — Nov 5, 2026
- Bias: Bearish
- Timeframe: 43 days (made Nov 5, 2026, target date Dec 18, 2026)
- Price at analysis: $582.69
- Price target: $555.00
- Expected range: $500.00 – $605.00
- Result: Pending — graded after the close on Dec 18, 2026
Get a free AI analysis of LITE today
Analysis
TECHNICAL INDICATORS
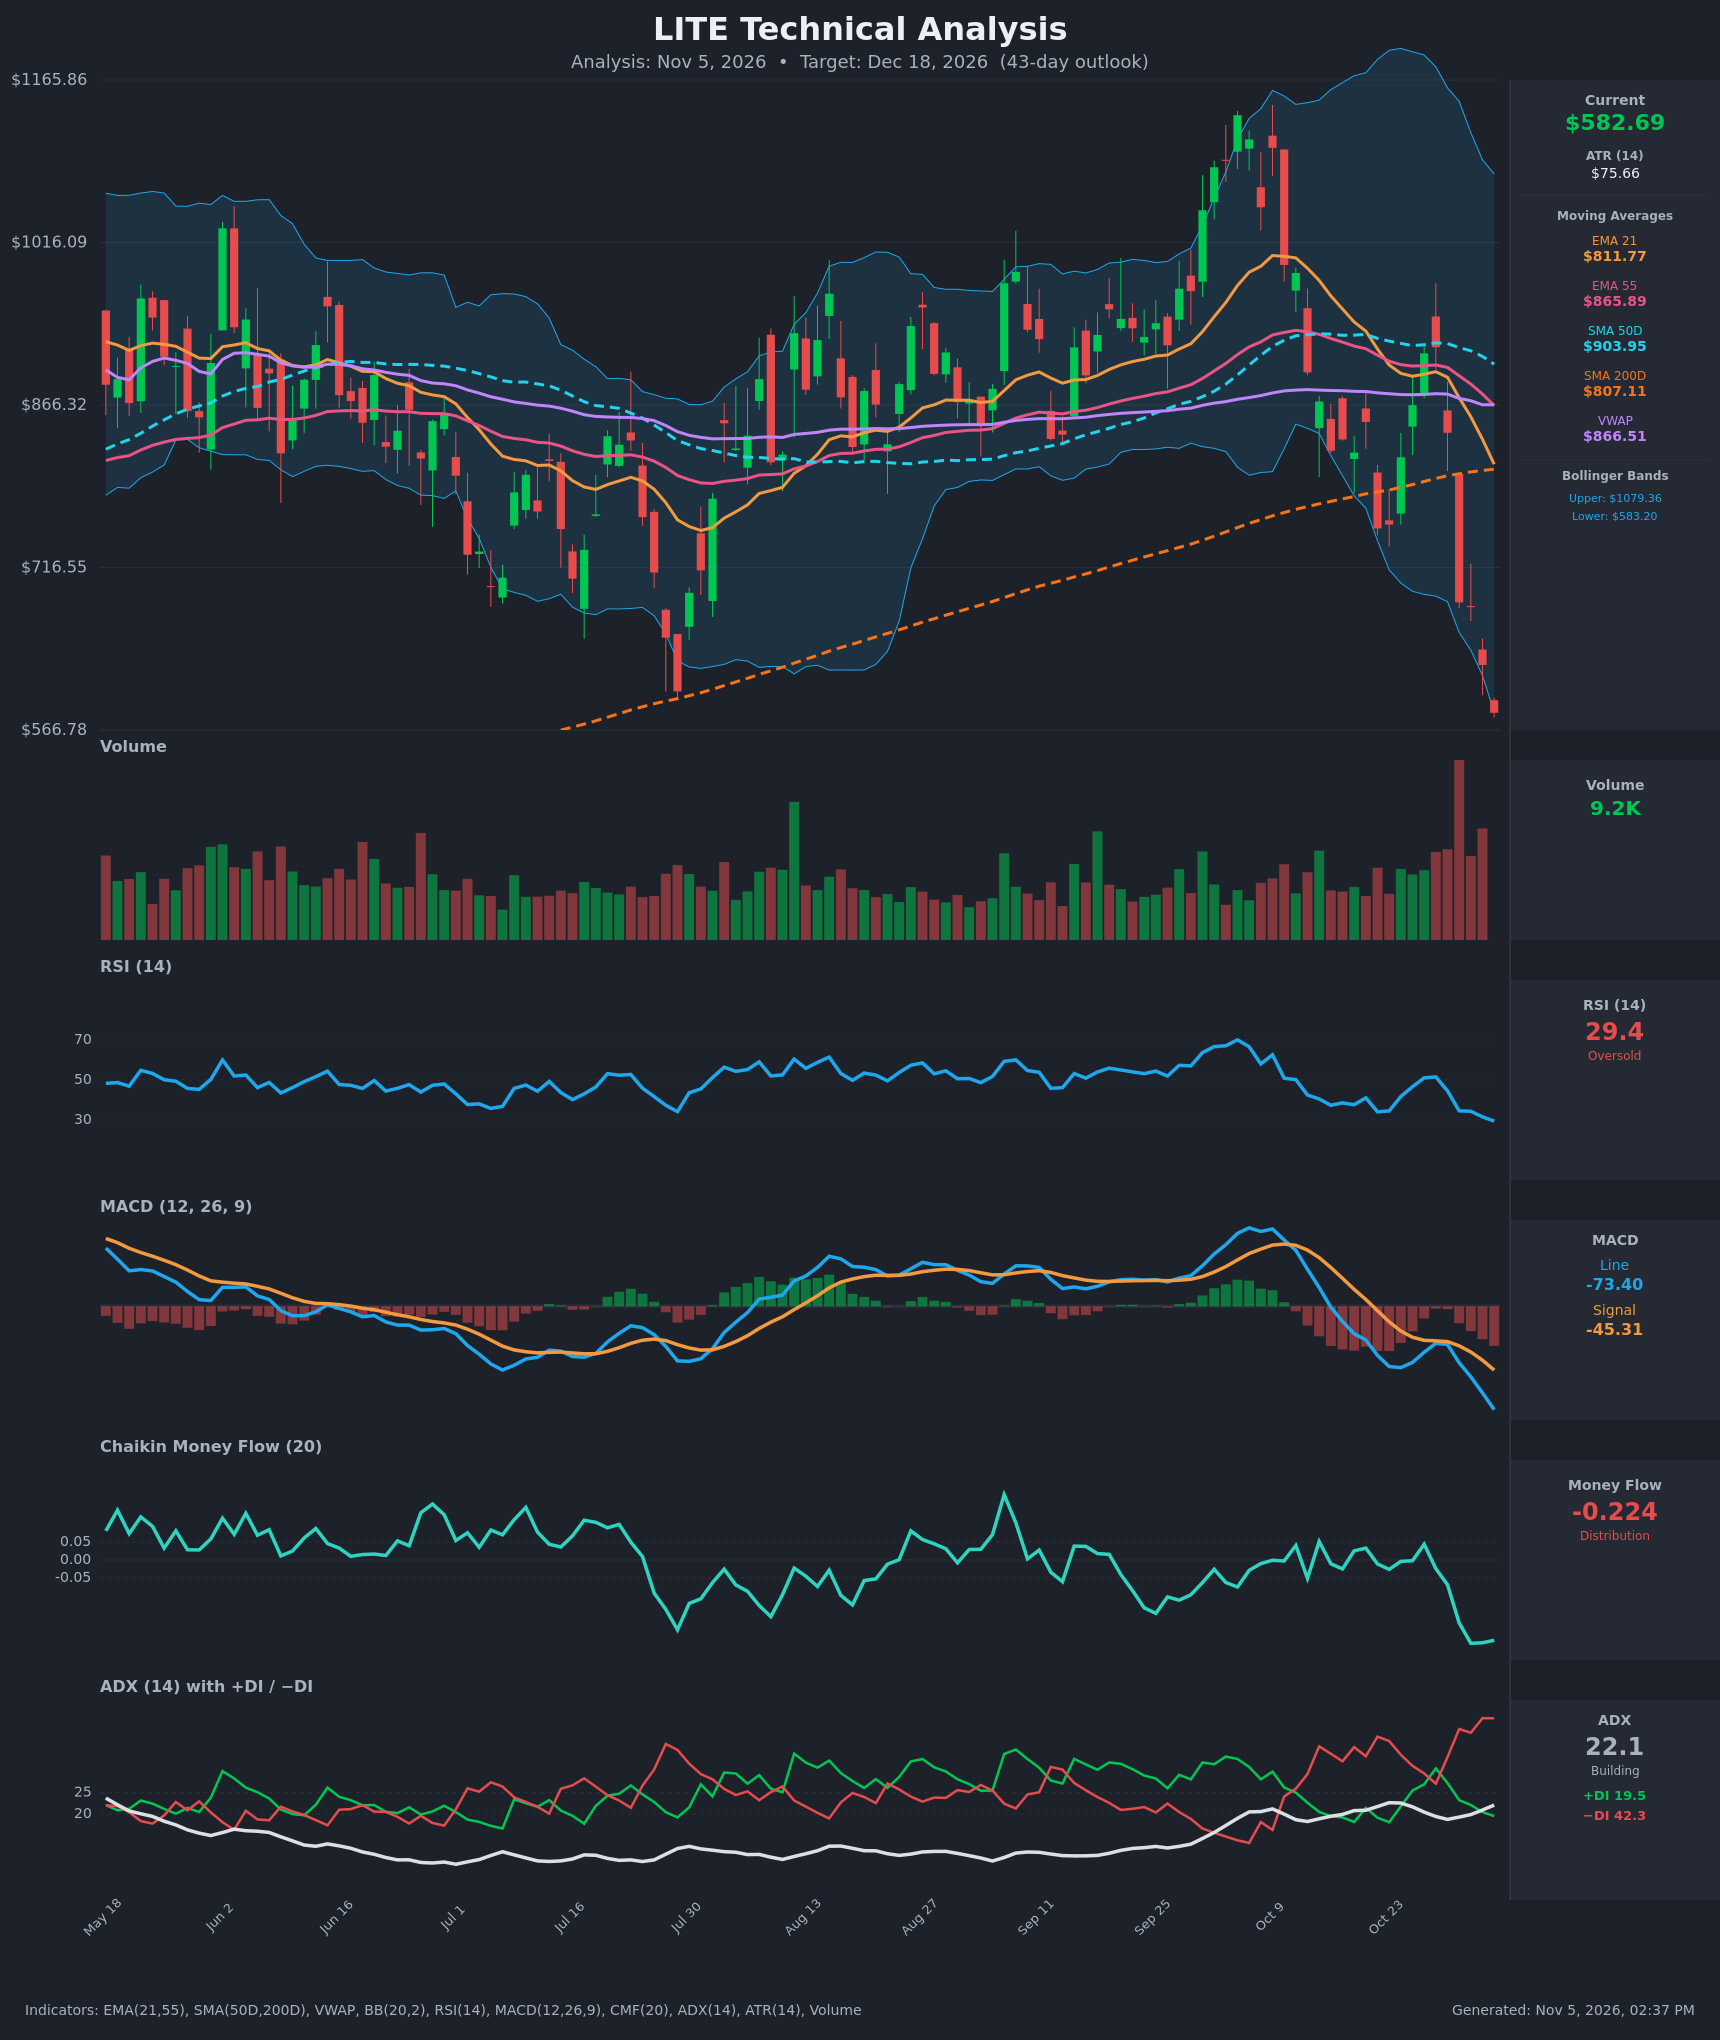
- RSI (14): 29.44, in oversold territory and down from 51.6 on Oct 29, so momentum fell sharply. It has not yet turned up or made a bullish divergence. Oversold readings can persist in a trending decline. [Bearish]
- 20 EMA: The chart shows EMA 21 at $811.77, with price at $582.69, about 28% below it. EMA 21 is also below EMA 55 ($865.89). It crossed under EMA 55 around Oct 22-23, and the gap is widening. The EMA is now overhead resistance. [Bearish]
- MACD: Line -73.40 is below Signal -45.31, a histogram of about -28 that keeps widening. The bearish crossover happened around Oct 22 and the line is still accelerating down, so there is no sign of momentum exhaustion yet. [Bearish]
- Bollinger Bands (20): Price ($582.69) is at or just below the lower band ($583.20), and the bands are expanding sharply (upper $1079). This is a band walk after a volatility expansion. It is stretched, but a lower-band tag in an expanding, trending move is not a reversal signal by itself. [Bearish]
- CMF (20): -0.224, well below -0.05. It fell from roughly 0 to -0.23 in the last four sessions, which shows heavy, persistent distribution. [Distribution]
- ADX (14): 22.1 and rising from about 19. −DI (42.3) is far above +DI (19.5), so bears are in control. The trend is not yet "strong" (>25), but it is building and the direction is clearly down. [Building Trend – Bearish]
- Volume: The latest reading is 9.2K. The chart's biggest volume spike of the period came on the Nov 2 breakdown candle, with elevated volume on Nov 3-4. Heavy volume on a gap down confirms forced or institutional selling, though it could also mark capitulation. [Bearish – high-volume breakdown]
DIVERGENCES & TRENDS
- No bullish divergence yet. Price made a new low ($582.69, below the July low near $620-650) while RSI (29.4), MACD and CMF all made new lows too. The indicators confirm the price weakness.
- Moving averages: Price is below EMA 21, EMA 55, SMA 50D ($903.95), SMA 200D ($807.11) and VWAP ($866.51). The break below the SMA 200D is a significant long-term trend break. No death cross has formed yet, but SMA 50D is rolling over toward the rising SMA 200D.
- Crossovers: EMA 21 crossed below EMA 55 (bearish). MACD crossed below its signal (bearish). −DI crossed above +DI and the gap widened. Everything lines up bearish.
- Price structure: The Oct 9 peak near $1,130 was followed by a lower high near $920 on Oct 29, then a roughly 37% crash in 5 sessions. Support around $620-$750 failed.
- Oversold caveat: RSI near 29 and a lower-band tag raise the odds of a relief bounce. The bounce is likely to meet resistance at the $680-$750 gap zone.
CHART PATTERNS
- There is no clean textbook completion. The structure is closest to a bearish reversal (similar to the Bearish Double Top / lower-high sequence): a blow-off peak around $1,130, a lower high near $920, then a decisive break of the $750-$820 support shelf.
- A measured move of the breakdown suggests continued weakness. The failed $750 neckline-type support now acts as resistance.
- If price stabilizes, a Bullish Falling Wedge or a Bullish Double Bottom could develop near $550-$600. Neither is confirmed, and the current evidence favors continuation lower or a weak consolidation.
POTENTIAL SCENARIOS
- Scenario 1: Bearish Continuation / Grind Lower — Distribution (CMF -0.22), −DI dominance and a widening MACD gap suggest sellers keep control. Price pushes to new lows after a minor bounce fails below the $680-$700 area. Trigger: daily close below $566.78 (the chart low). Target: $520-$555, with an extreme low near $500. Invalidation: a daily close above $684.40 on rising volume. (50% probability)
- Scenario 2: Bullish Oversold Relief Bounce — RSI near 29 and a lower Bollinger Band tag at a dramatic 37% drop invite a mean-reversion rally. The bounce stalls at falling EMA 21/VWAP resistance. Trigger: RSI turning back above 35 with MACD histogram shrinking and a close above $684.40. Target: $700-$750, with a stretch to the EMA 21 zone near $800. Invalidation: a close back below $566.78. (35% probability)
- Scenario 3: Neutral Base Building — Price forms a basing range between about $550 and $650 as volatility contracts. Trigger: several closes holding $566-$650 with ADX flattening. Target: $580-$620. Invalidation: a close outside either side of the range. (15% probability)
PRICE TARGETS
- Target Price: $555.00 (43-day target)
- Expected Range: $500.00 to $605.00. The width is $105, about 18% of the current price, which fits the 30-60 day guidance.
- Key Levels: Support at $566.78, Resistance at $684.40
OVERALL BIAS
OVERALL BIAS: BEARISH - Price is below every moving average and VWAP, MACD and −DI are firmly bearish, CMF shows heavy distribution after a high-volume breakdown, and there is no bullish divergence. Oversold RSI raises the risk of a sharp relief bounce, but resistance at $684 and above should cap it, so the path of least resistance is still lower.
This is educational analysis and not financial advice.