APP 25-day bullish forecast — Nov 5, 2026
- Bias: Bullish
- Timeframe: 25 days (made Nov 5, 2026, target date Nov 30, 2026)
- Price at analysis: $357.54
- Price target: $375.00
- Expected range: $335.00 – $395.00
- Result: Pending — graded after the close on Nov 30, 2026
Get a free AI analysis of APP today
Analysis
TECHNICAL INDICATORS
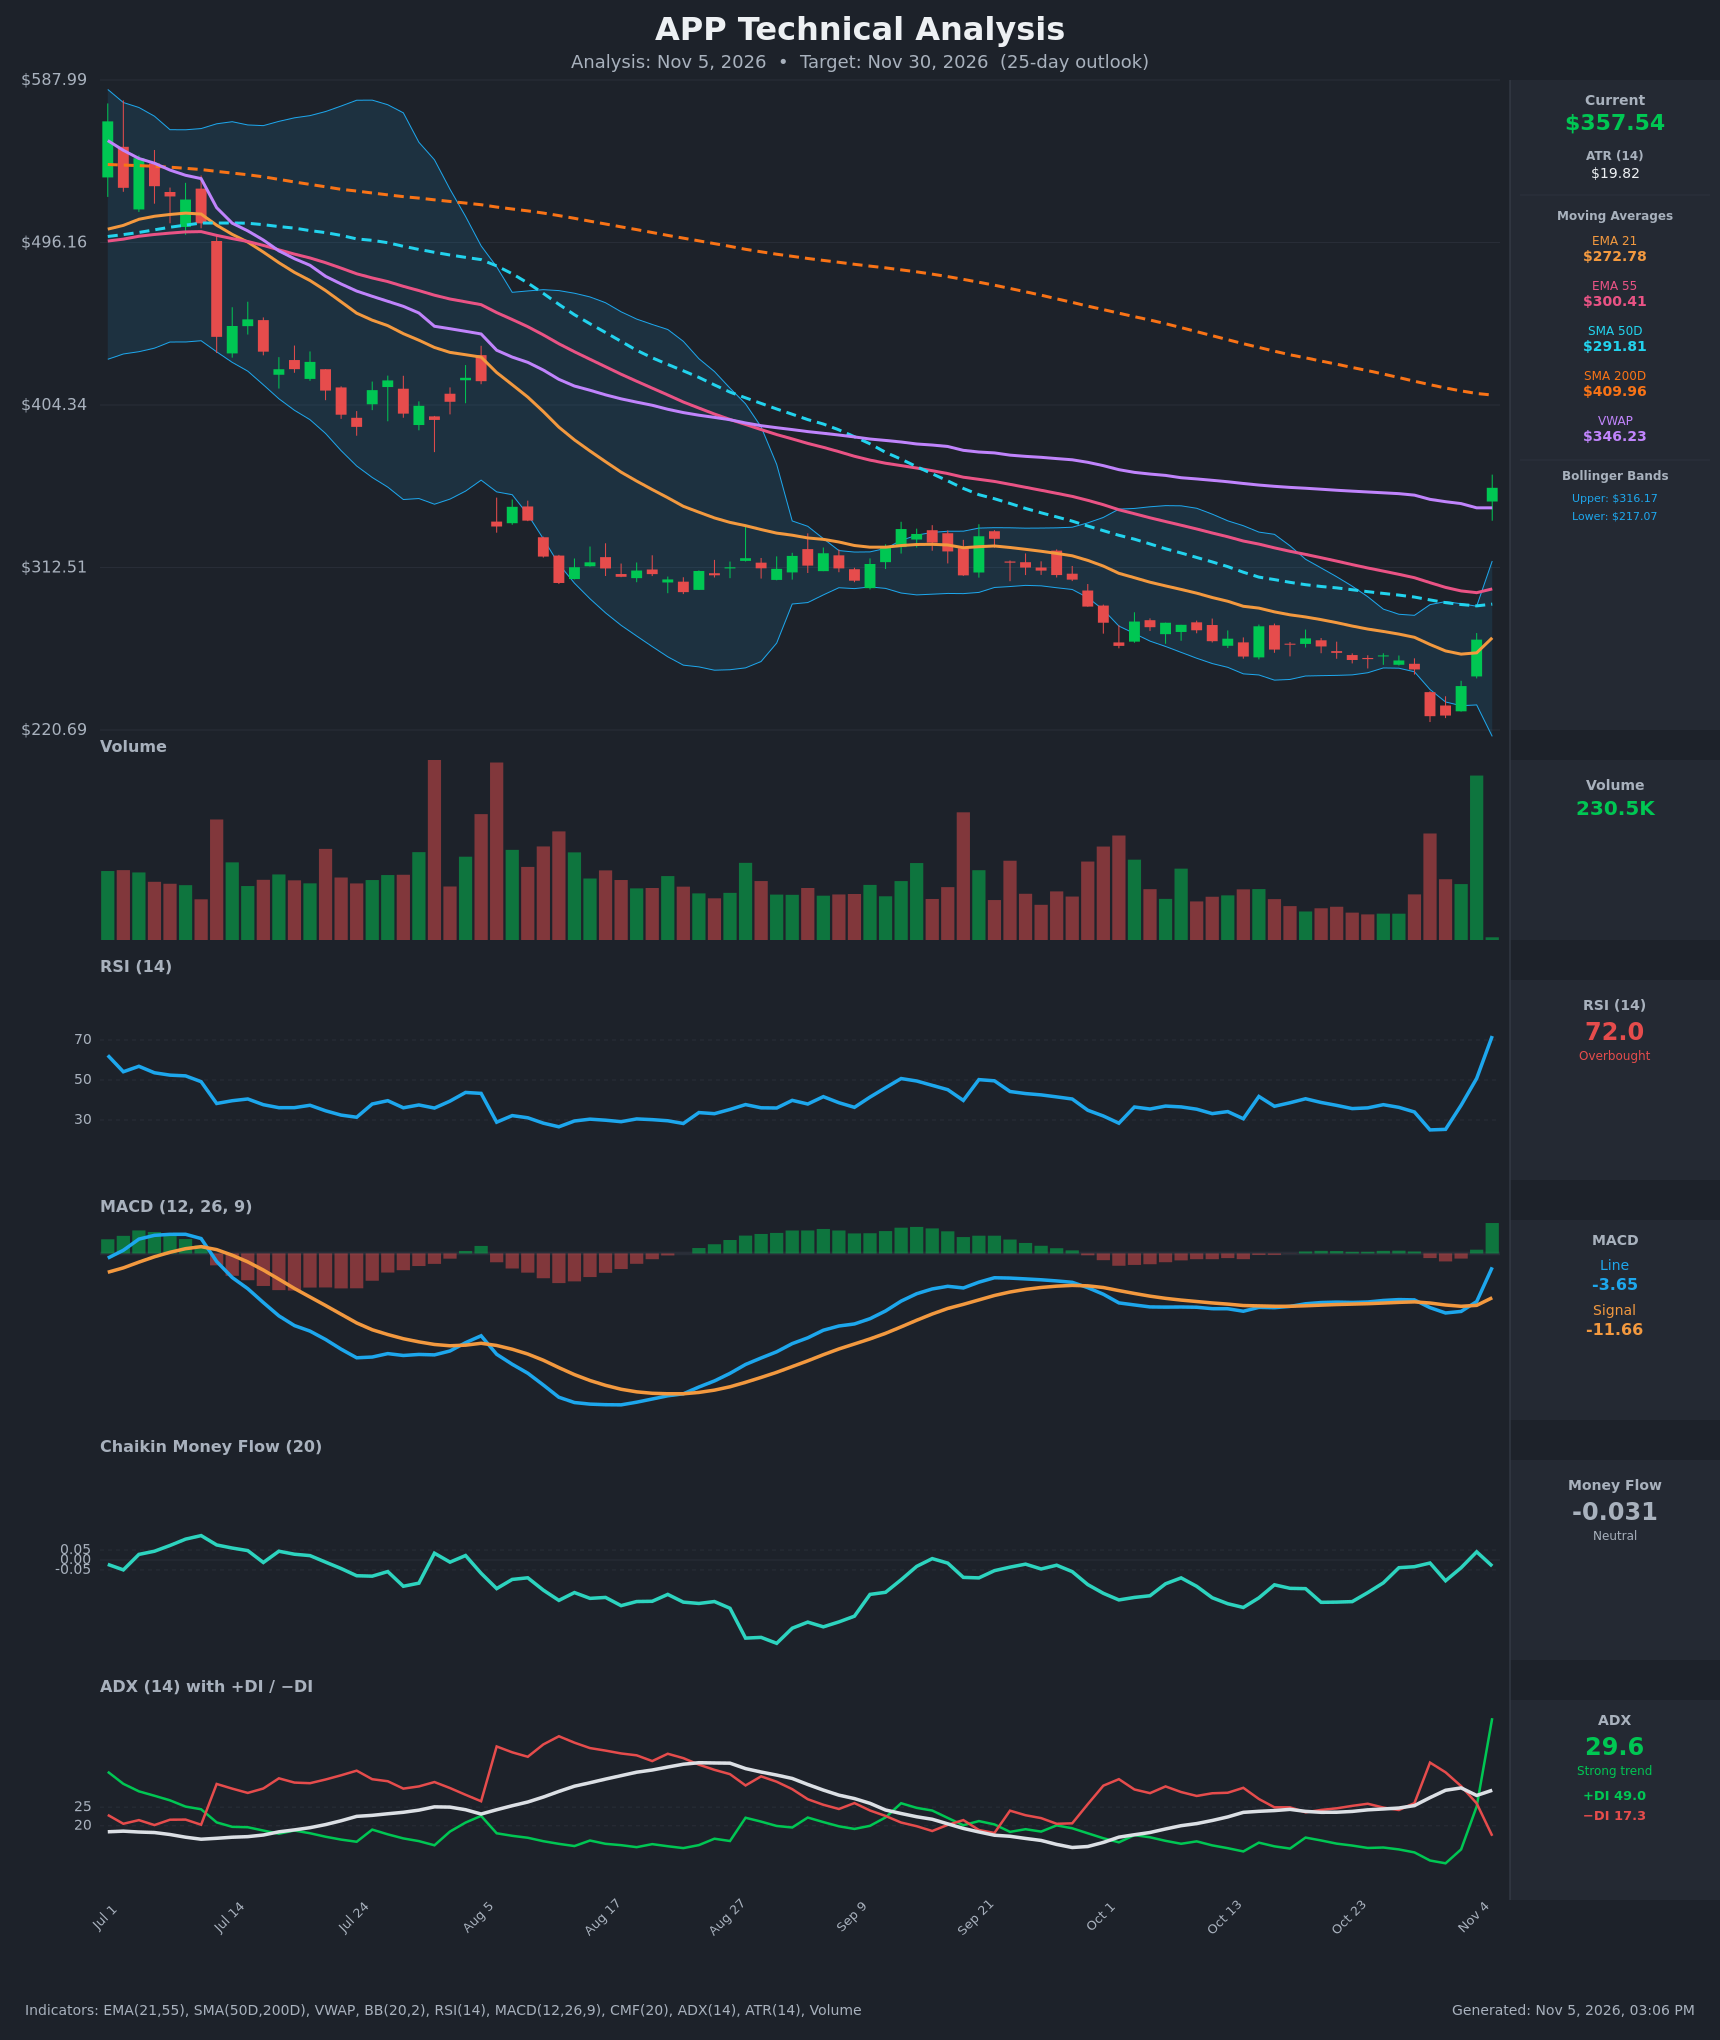
- RSI (14): 71.99, up from 25.0 on Oct 30 and 50.8 on Nov 4. That is a vertical momentum swing and the first overbought reading in the visible window. Strong momentum, but short-term stretched. [Bullish]
- 20 EMA (21 EMA = $272.78): Price at $357.54 is about 31% above the EMA 21 and also above the EMA 55 ($300.41). The EMA 21 is still below the EMA 55, so there is no bullish crossover yet. Price is far extended from the averages. [Bullish]
- MACD: Line -3.65 is above signal -11.66, with a sharply positive histogram. The line crossed above the signal around Nov 4 and is rising fast toward the zero line. It is still below zero, so the longer-term structure has not fully turned. [Bullish]
- Bollinger Bands (20): Price at $357.54 is well above the upper band ($316.17, mid ~ $266.62), roughly $41 outside it. The bands are starting to expand after a squeeze at the lows. A close this far outside signals a momentum breakout, but also a high chance of mean reversion toward the upper band or mid-band. [Neutral]
- CMF (20): -0.031 sits in the neutral zone (between -0.05 and +0.05). It was only +0.041 on Nov 4 and has slipped back despite a ~32% price jump. Money flow is not confirming the breakout, which is a mild warning. [Neutral]
- ADX (14): 29.6 with +DI 49.0 well above −DI 17.3. +DI crossed above −DI on Nov 4 and the spread is now very wide. Trend strength is above 25, though the ADX itself is still catching up to the move. [Strong Trend – Bullish]
- Volume: The surge bar on the breakout day is the largest of the recent sessions, which marks a clear event or earnings-type gap. The most recent partial bar is tiny and not meaningful. Heavy volume on the up move supports the breakout, though a gap this large often leads to follow-through or partial retracement. [Bullish – confirming breakout]
DIVERGENCES & TRENDS
- CMF vs price: Price is up ~32% in one session while CMF is flat and neutral at -0.031. This is a mild negative divergence, so accumulation is less convincing than the price move.
- MACD: The bullish crossover is fresh, with a rapidly expanding histogram. It is still below zero, so it is a recovery signal and not yet a confirmed trend change.
- RSI: It surged from 25 to 72 in six sessions. Overbought readings in a new trend can persist, but they often precede consolidation.
- Moving averages: Price has reclaimed EMA 21, EMA 55, SMA50D and VWAP ($346.23) in one candle. Price is still below the SMA200D ($409.96), and SMA50D ($291.81) is below SMA200D, so the death cross remains in force and the long-term trend is still down.
- DMI: The +DI/−DI flip (49.0 vs 17.3) is a decisive bullish shift in directional control.
CHART PATTERNS
- Bullish Falling Wedge / downtrend exit: From the Aug–Oct period, price made lower lows with narrowing ranges, then broke upward with a large gap. This matches the Bullish Falling Wedge reversal in the reference diagram. The measured move of a wedge breakout usually targets the wedge's starting area. The nearest major overhead levels are the SMA200D at ~$410 and the prior consolidation near $400.
- Gap/breakout through Bollinger Bands: This is a volatility-expansion breakout. The gap zone ($272–$346) is potential support on a retest, and a retracement toward the upper Bollinger Band (~$316) would still be a normal retest.
- The distance to the SMA200D (~$52 above) is about 2.6 ATRs, so it is reachable within 25 days.
POTENTIAL SCENARIOS
- Scenario 1: Bullish Breakout Continuation — After the gap, price consolidates above VWAP ($346) and then pushes toward the falling SMA200D. Post-event drift, a wide +DI/−DI spread and a positive MACD histogram support follow-through. Trigger: hold above $346 and close above ~$375. Target: $390–$410 (SMA200D area). Invalidation: daily close below $335. (50% probability)
- Scenario 2: Bearish Gap Fade / Retest — Overbought RSI, the price far outside the Bollinger Bands, neutral CMF and the death-cross backdrop lead to a pullback to fill part of the gap. Trigger: failure at $375–$380 and a close below VWAP $346. Target: $316 (upper Bollinger Band), potentially $300 (EMA 55). Invalidation: a close above $380 that holds. (35% probability)
- Scenario 3: Neutral Consolidation — Price digests the gap in a range between VWAP and the mid-$300s to $380 as RSI cools. Trigger: low-volume sideways candles between $345 and $375. Target: $350–$370. Invalidation: a close outside $335–$395. (15% probability)
PRICE TARGETS
- Target Price: $375.00 (25-day, Nov 30, 2026)
- Expected Range: $335.00 to $395.00 (width $60 ≈ 16.8% of current price, consistent with the 25-day timeframe guidance of ~12–18%)
- Key Levels: Support at $346.23 (VWAP, top of the gap zone, with $316.17 below it), Resistance at $409.96 (SMA200D)
OVERALL BIAS
OVERALL BIAS: BULLISH - A high-volume gap breakout through all major short-term averages, a fresh MACD bullish crossover, and +DI dominating −DI with ADX near 30. The risks are an overbought RSI, price far outside the Bollinger Bands and neutral CMF, so a retest of $346 or lower is likely along the way.
This is educational analysis and not financial advice.