FTNT 48-day bearish forecast — Nov 10, 2026
- Bias: Bearish
- Timeframe: 48 days (made Nov 10, 2026, target date Dec 28, 2026)
- Price at analysis: $121.78
- Price target: $114.00
- Expected range: $104.50 – $124.50
- Result: Pending — graded after the close on Dec 28, 2026
Get a free AI analysis of FTNT today
Analysis
TECHNICAL INDICATORS
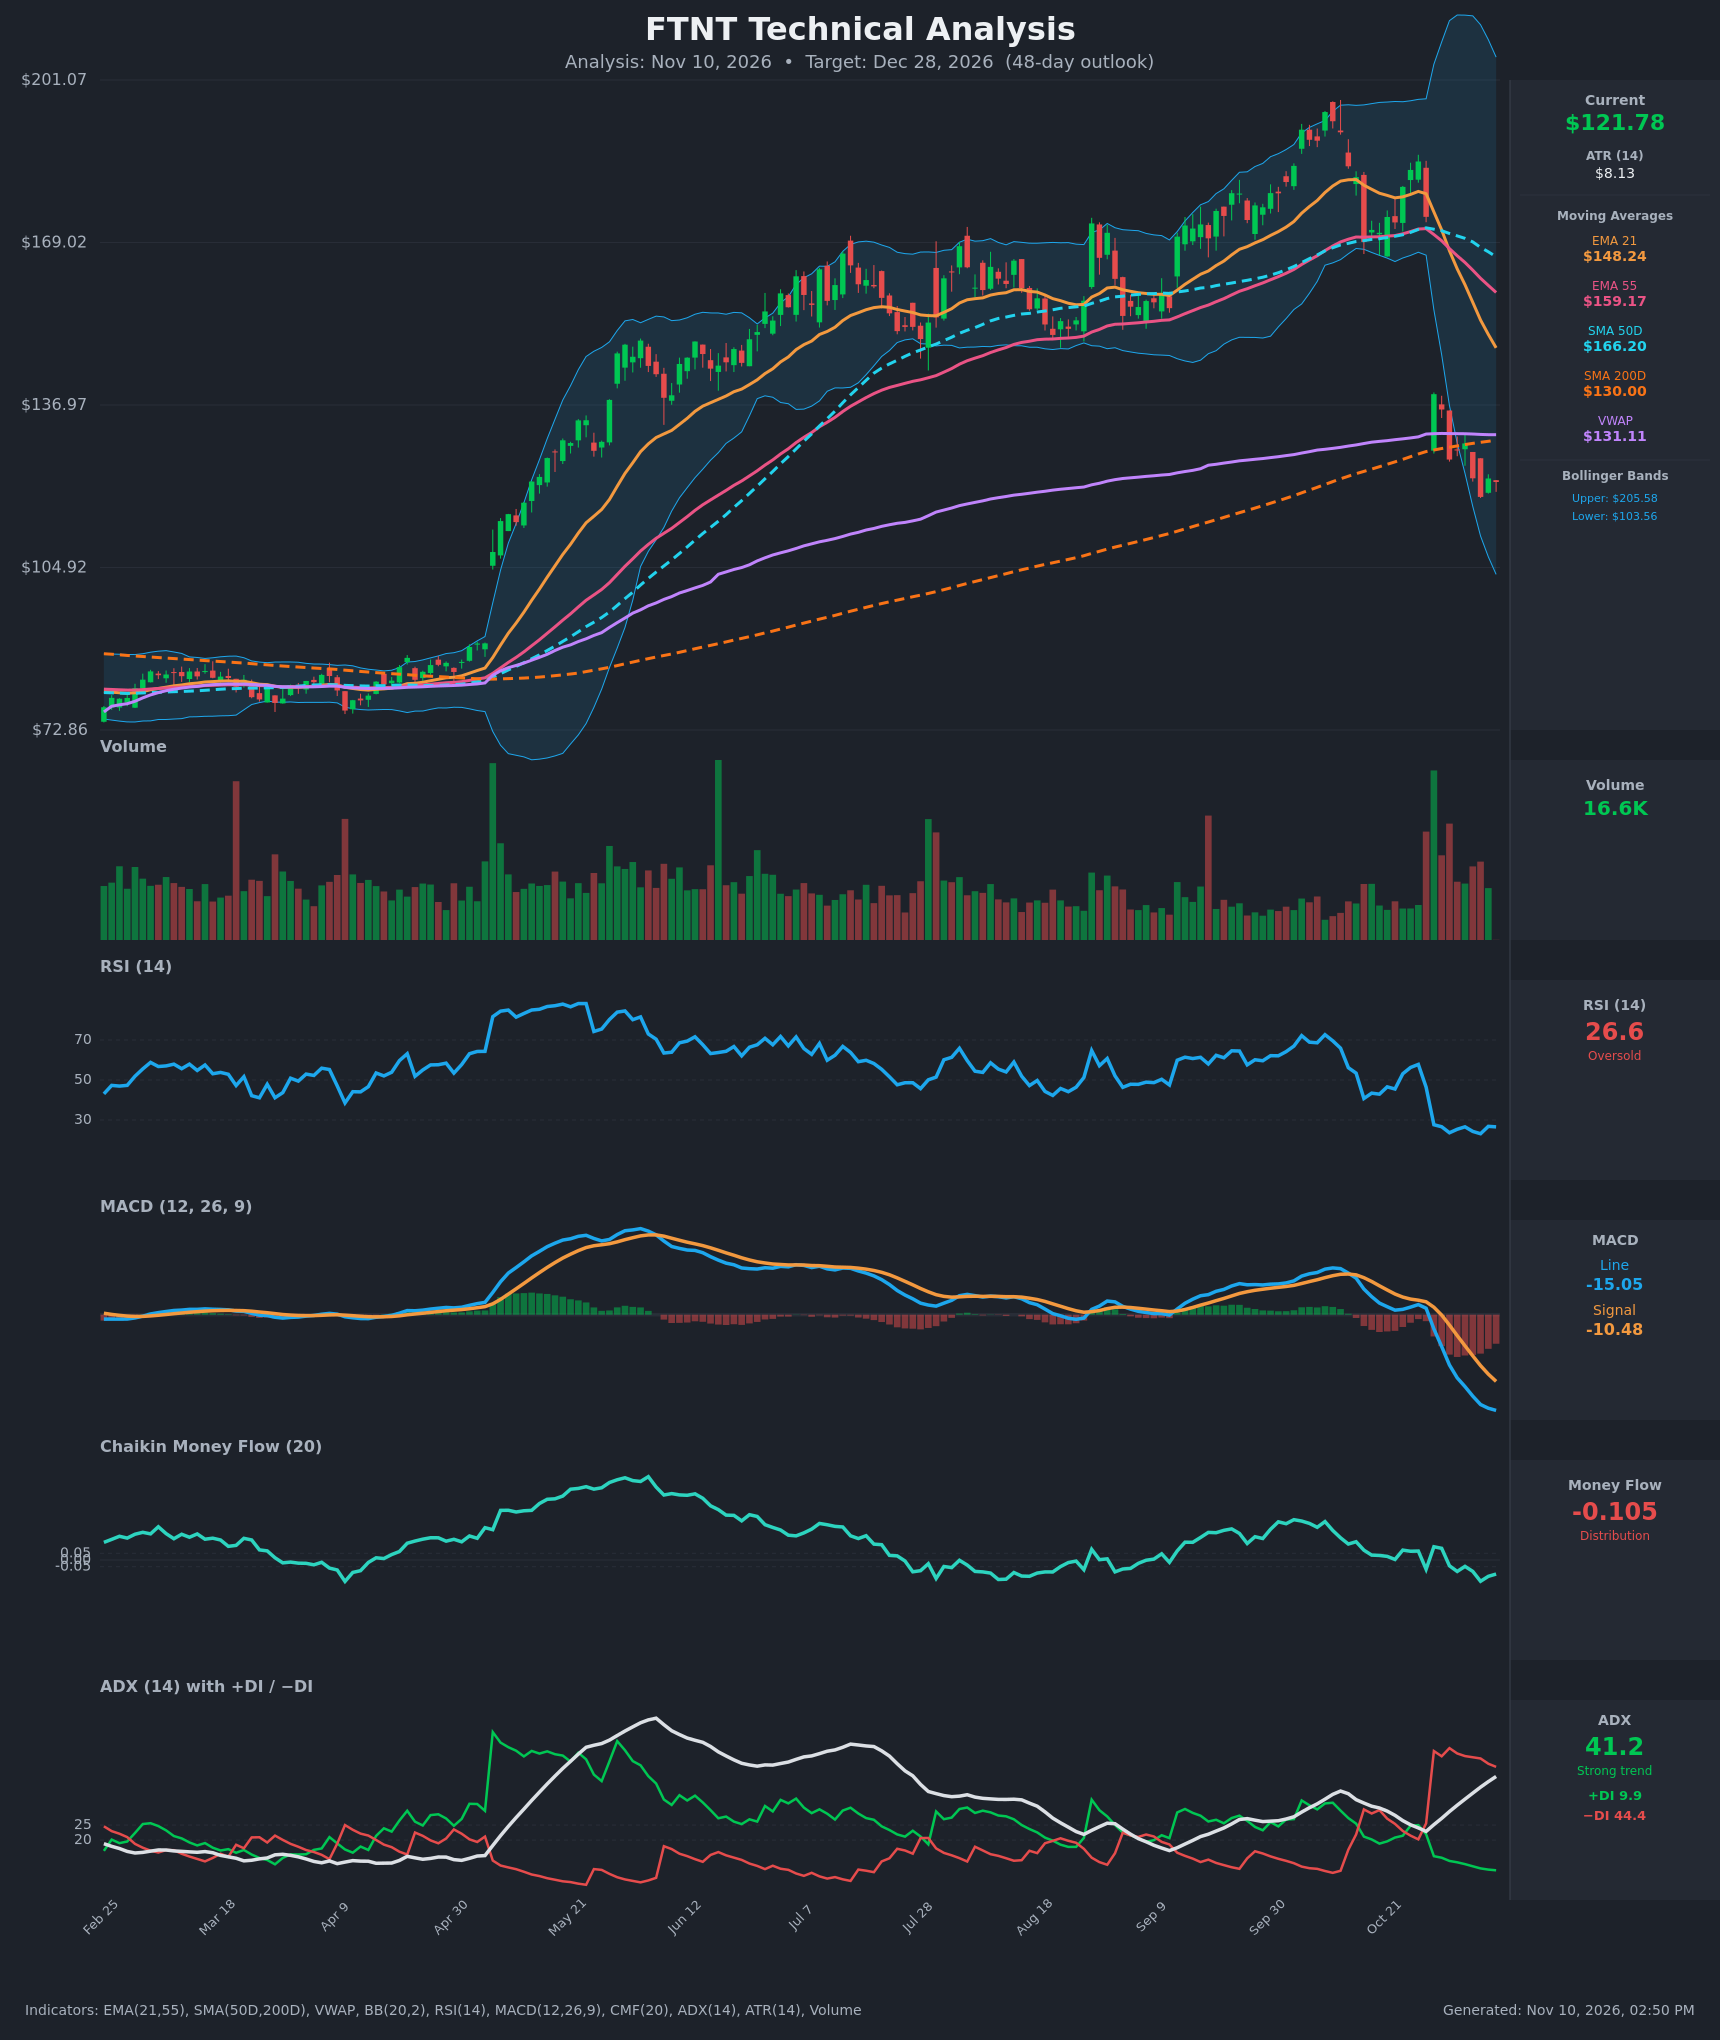
- RSI (14): 26.57, oversold (<30) and has been in the 23–27 zone for about 8 sessions. Momentum is weak and not yet turning up. Oversold readings in a strong downtrend can persist, but they raise the odds of a relief bounce. [Bearish]
- 20 EMA (EMA 21 = $148.24): Price at $121.78 is about 18% below it, and the EMA is falling steeply. It is overhead resistance. EMA21 crossed below EMA55 ($159.17) on Nov 2, a bearish crossover. [Bearish]
- MACD: Line -15.05 is below Signal -10.48, with a widening negative histogram. The bearish crossover came on Oct 29–30, and the line is still making new lows. There is no sign of momentum bottoming yet. [Bearish]
- Bollinger Bands (20): Upper $205.58, lower $103.56. The bands are very wide after the Oct 29 gap-down volatility spike. Price is in the lower third of the bands, about $18 above the lower band. This is stretched but not a band-walk extreme, and the lower band is a downside magnet. [Bearish]
- CMF (20): -0.105, below -0.05 and negative in most recent sessions. This is consistent distribution and no accumulation has appeared on the bounce attempts. [Distribution]
- ADX (14): 41.2 and rising (from 22.9 on Oct 28), a strong trend. −DI (44.4) is far above +DI (9.9), so bears are firmly in control. [Strong Trend – Bearish]
- Volume: The reading is 16.6K, small relative to the heavy red volume spike on the Oct 29 gap-down. The bounces since then have come on fading volume, so there is no convincing buying interest. The gap-day volume marks institutional repricing. [Bearish – weak bounce participation]
Other moving averages:
- SMA 200D ($130.00): Price has closed below it, losing the long-term trend line.
- VWAP ($131.11): Price is below it, which reflects selling pressure.
- SMA 50D ($166.20): It is far overhead and falling. A death cross (SMA50 below SMA200) has not occurred, but the gap is closing quickly.
DIVERGENCES & TRENDS
- No bullish divergence yet. Price made a lower close on Nov 6 ($118.84) and RSI also made a lower low (23.1). Momentum confirms price, so there is no reversal signal.
- Trend deterioration: The sequence from a Bollinger upper-band push (~$185) to a $35 one-day gap-down (Oct 29) is a classic blow-off and breakdown.
- Crossovers and breaks:
- MACD bearish crossover on Oct 29–30.
- EMA21 crossed below EMA55 on Nov 2.
- Price lost SMA200D and VWAP.
- −DI crossed above +DI on Oct 28 and the spread has widened to about 35 points.
- ADX rising with −DI dominant means the downtrend is strengthening, not exhausting.
- Mean-reversion risk: RSI around 23–27 for several days, price about 18% below EMA21 and a −DI spike are the type of conditions where relief rallies appear. A bounce toward the $130–$131 zone (SMA200/VWAP) is plausible, but that zone should act as resistance.
CHART PATTERNS
- Gap-down breakdown from a failed uptrend: A rising channel peaked near $185 and broke down sharply. This resembles a Bearish Head and Shoulders / Double Top-type reversal from the reference diagram. The left shoulder and head formed in the Sep–Oct highs, and the breakdown sits below the ~$160–170 base.
- Possible Bearish Flag / Pennant: Since the gap, price has been drifting sideways between about $118 and $130 with small bounces on lower volume. This is a continuation structure, and a break below ~$118 projects lower. The measured move from the flagpole is large (~$35–50), but a realistic 48-day target is near the lower Bollinger Band at ~$103–$105.
- Caveat: The Bullish Falling Wedge / Double Bottom-type reversal would need a close above $130 with volume. That is not present.
POTENTIAL SCENARIOS
- Scenario 1: Bearish Continuation Lower — Failed bounces at the $126–$131 zone (SMA200/VWAP) are followed by a break of the $118.84 low as the bear-flag resolves down, with the strong ADX and −DI dominance sustaining the trend. Trigger: daily close below $118.00 on rising volume. Target: $110–$114, extending to the lower Bollinger Band near $103.56. Invalidation: daily close above $131 (VWAP/SMA200) with RSI back above 40. (50% probability)
- Scenario 2: Bullish Oversold Relief Bounce — RSI at 26 and a stretched distance from the EMAs trigger short covering and a mean-reversion rally toward the gap and the falling EMA21. Trigger: close above $130–$131 with volume expansion and a MACD histogram turn. Target: $140–$148 (gap zone and EMA21). Invalidation: failure at $131 and a close below $118.84. (35% probability)
- Scenario 3: Neutral Base Building — Price chops between roughly $112 and $130 as selling exhausts and the ADX cools. Trigger: ADX rolling over from above 40 with RSI holding above 25. Target: $118–$126. Invalidation: close outside the $110–$131 range. (15% probability)
PRICE TARGETS
- Target Price: $114.00 (48-day outlook, Dec 28, 2026)
- Expected Range: $104.50 to $124.50 (width $20.00 ≈ 16.4% of current price, consistent with the 30–60 day guidance of 12–18%)
- Key Levels: Support at $118.84 (Nov 6 closing low; secondary at the $103.56 lower Bollinger Band), Resistance at $130.00 (SMA200D, with VWAP at $131.11)
OVERALL BIAS
OVERALL BIAS: BEARISH - A strong, rising downtrend (ADX 41.2, −DI 44.4 vs +DI 9.9), a MACD bearish crossover, the EMA21/EMA55 bearish cross, negative CMF (distribution) and a post-gap breakdown below SMA200 and VWAP outweigh the oversold RSI. Rallies into $130 are likely to meet resistance, with downside toward the mid-$110s and a possible test of the lower Bollinger Band.
This is educational analysis and not financial advice.