VRT 31-day bearish forecast — Nov 10, 2026
- Bias: Bearish
- Timeframe: 31 days (made Nov 10, 2026, target date Dec 10, 2026)
- Price at analysis: $191.06
- Price target: $183.00
- Expected range: $166.00 – $197.00
- Result: Pending — graded after the close on Dec 10, 2026
Get a free AI analysis of VRT today
Analysis
TECHNICAL INDICATORS
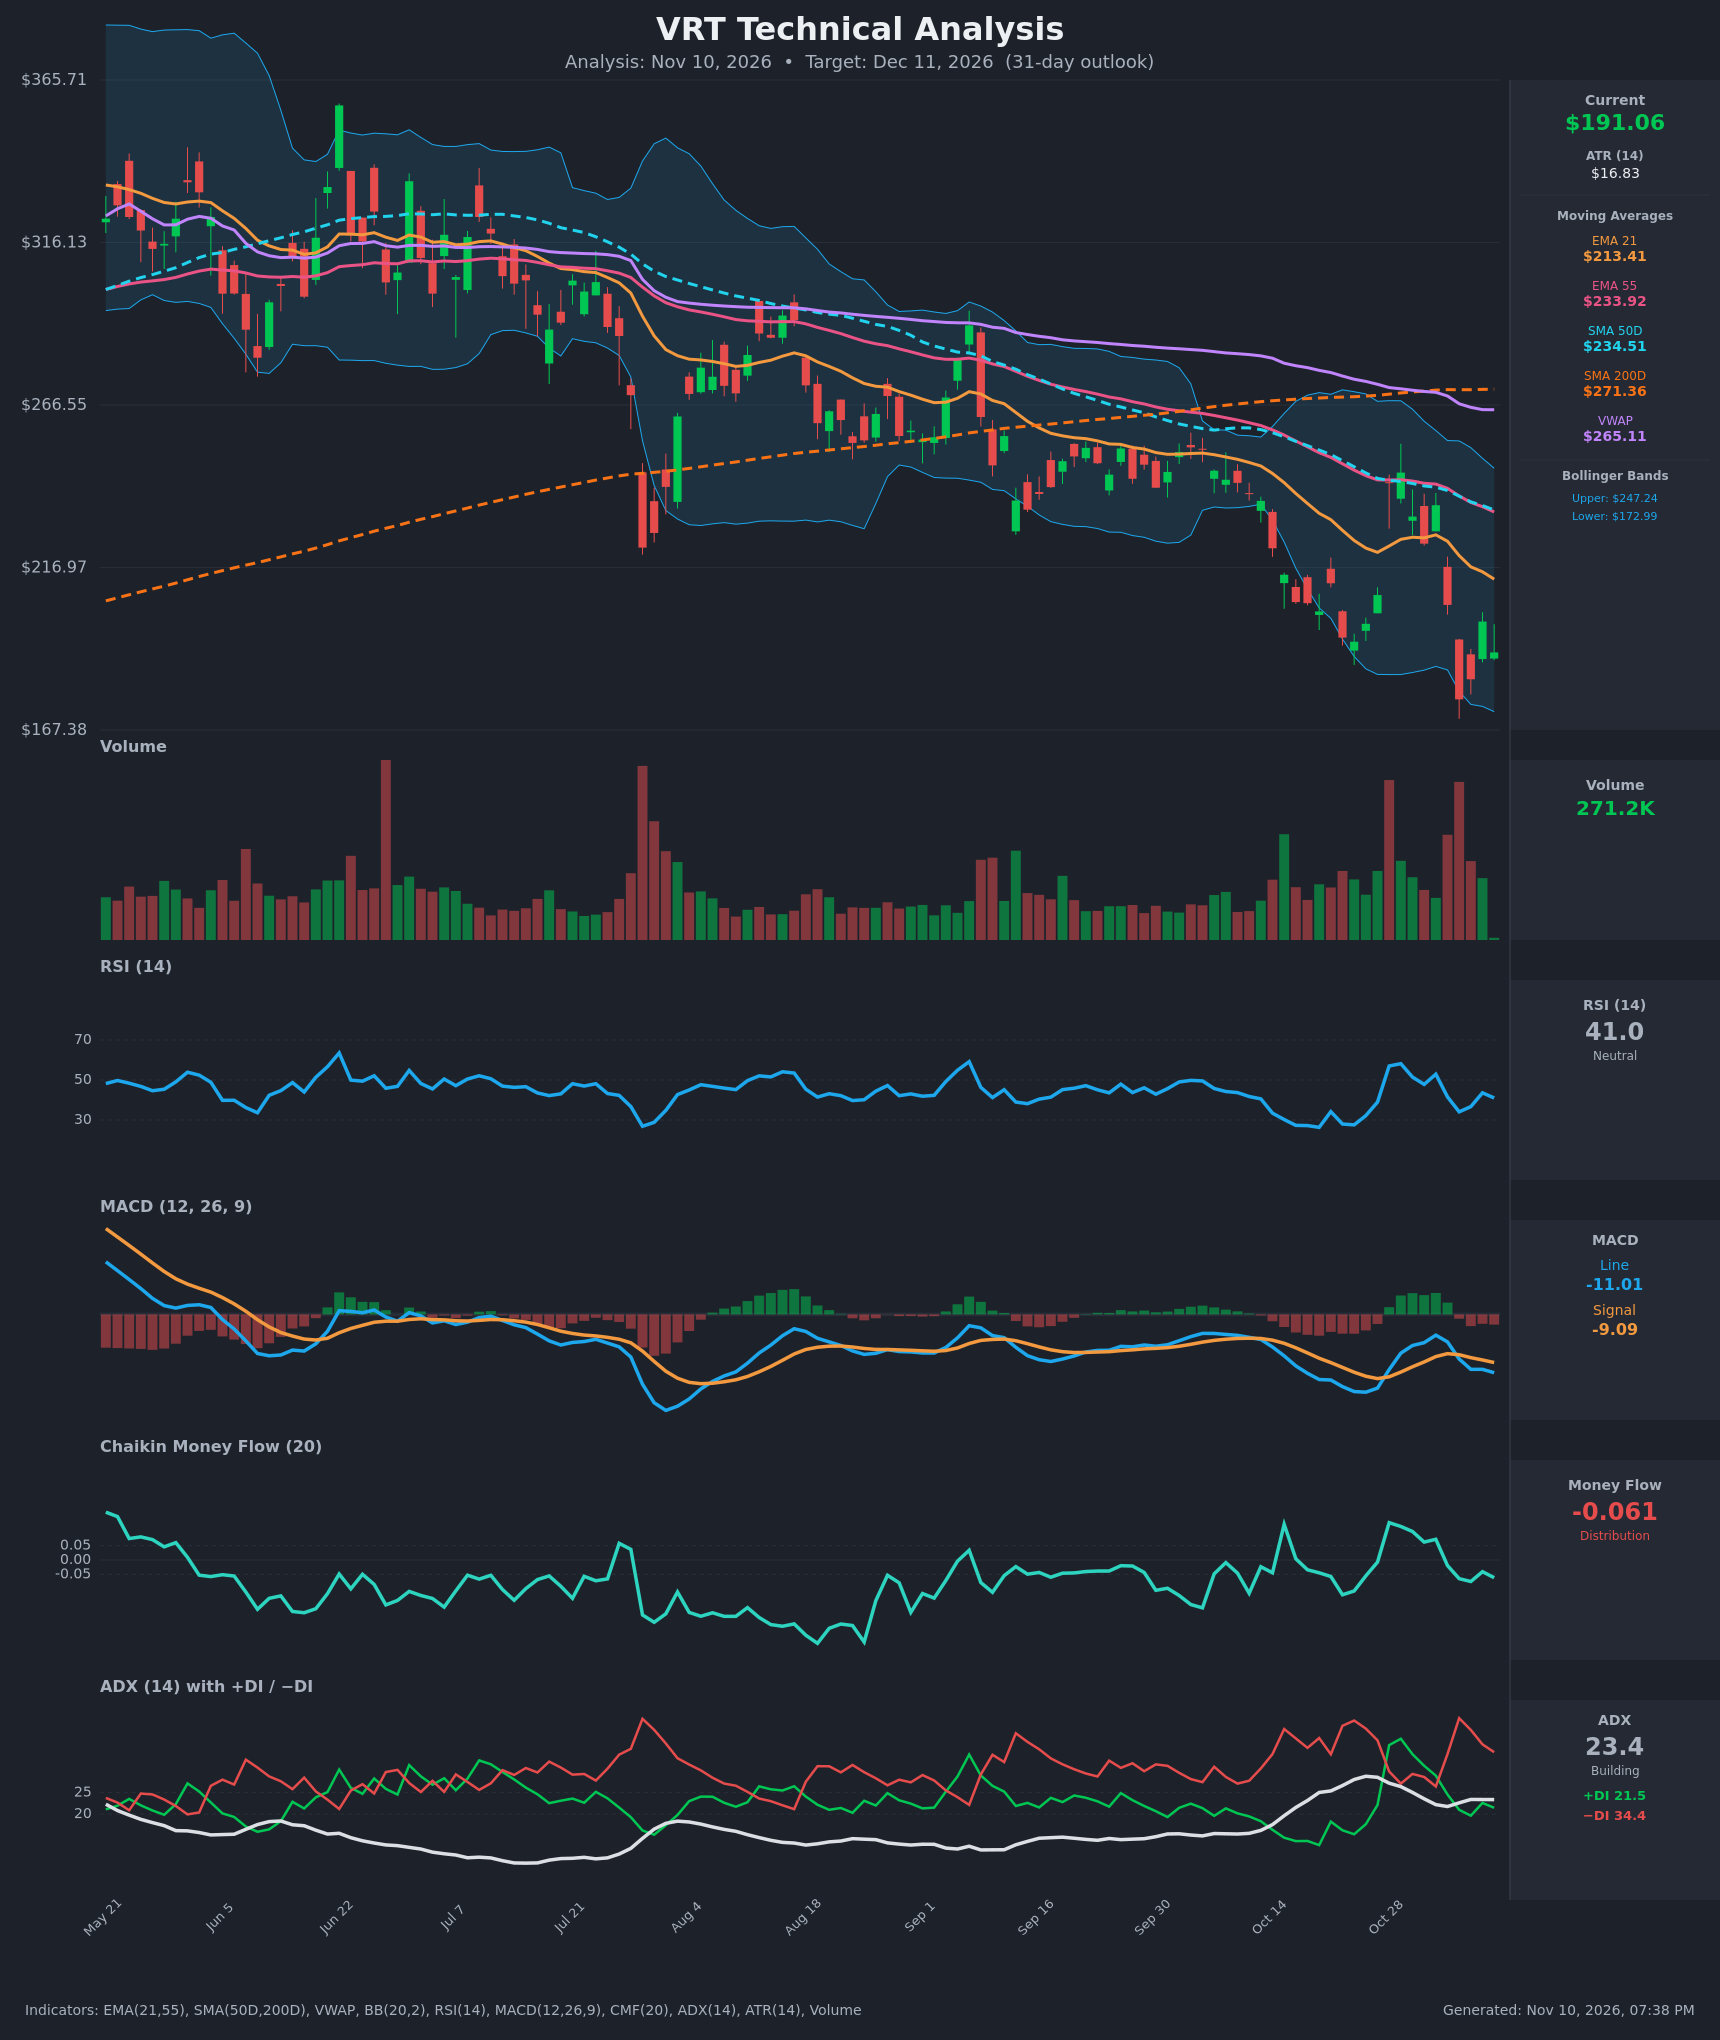
- RSI (14): 41.0, below the 50 midline and off the 27–28 oversold lows of Oct 22–23. The Oct 28–29 bounce to ~58 failed, and RSI has since made a lower high (~53 on Nov 3). Momentum is soft but not oversold. [Bearish]
- 20 EMA: The 21 EMA is $213.41 and price at $191.06 is about 10% below it. The EMA is falling and acts as dynamic resistance, and price has repeatedly failed to hold above it. [Bearish]
- MACD: Line -11.01 is below signal -9.09, a bearish crossover that re-emerged around Nov 5–6 after a brief convergence. The histogram is negative (about -1.9) and widening. Both lines are below zero. [Bearish]
- Bollinger Bands (20): Upper $247.24, lower $172.99, so price sits in the lower third, about 24% of the band width above the lower band. The bands are wide after the volatile swings. The Nov 5 close of $176.73 nearly tagged the lower band and bounced. Price is in a downtrend and still has room to the lower band. [Bearish]
- CMF (20): -0.061, just under the -0.05 distribution threshold after briefly turning positive in late October. Selling pressure is modest but persistent. [Distribution]
- ADX (14): 23.4 with -DI (34.4) well above +DI (21.5). ADX is near the 25 trend threshold, so the trend is moderate and the bears are in control. [Moderate Trend – Bearish]
- Volume: 271.2K on the latest bar, light compared with the heavy-volume selloff days (Oct 22, Nov 5). The large red volume bars on breakdowns show distribution, and the bounce has come on lighter volume. [Bearish – weak bounce participation]
DIVERGENCES & TRENDS
- No bullish RSI divergence yet. Price made new lows on Nov 5 ($176.73) while RSI (34) stayed above the Oct 23 low (27.6), a mild positive divergence. The lower highs in RSI and MACD since late October offset it.
- Moving average stack is fully bearish. Price ($191) < EMA21 ($213) < EMA55 ($234) < SMA50D ($234.5) < SMA200D ($271) < VWAP ($265). EMA21 crossed below EMA55 earlier, and SMA50D is well below SMA200D (death cross), so the long-term trend is down.
- Lower highs and lower lows. Peaks of ~$246 (Oct 29) and ~$236 (Nov 3) sit below earlier highs, and troughs are stepping down to $176.73.
- ADX/DI: -DI has been above +DI for nearly all of the last 15 bars apart from the Oct 28–Nov 3 rally. The latest DI spread has re-widened in favor of the bears.
- MACD has re-crossed bearishly and is moving back toward its earlier lows.
CHART PATTERNS
- Bearish Flag / Descending channel: After the sharp drop in mid-October, price has made a series of lower highs with volatile whipsaws. This resembles a bearish continuation structure, and a break below ~$176 would project further downside.
- Possible Bullish Falling Wedge / Double Bottom (lower probability): The Nov 5 low ($176.73) and the retest near $182–$191 hint at a potential double bottom with a neckline near $245. That needs a break above $213–$235 to confirm, and no confirmation exists yet.
- Measured move: The ~$70 drop from the Oct 29 high of ~$246 to the Nov 5 low of ~$177 is a reference for continuation. A bounce to $213–$220 followed by a rollover would fit the bearish-flag read.
POTENTIAL SCENARIOS
- Scenario 1: Bearish Continuation Lower — The downtrend persists with price rejected at the falling EMA21 (~$210) and a break below the Nov 5 low. Trigger: close below $176.73 and the lower Bollinger Band ($173). Target: $165–$172, with an extension to ~$158. Invalidation: daily close above $213 (EMA21). (50% probability)
- Scenario 2: Neutral Range Chop / Base Building — Price oscillates between $176 and $215 as oversold conditions are worked off, with ADX under 25. Trigger: holding the $176–$180 support area on light volume. Target: $185–$200. Invalidation: close below $172 or above $225. (25% probability)
- Scenario 3: Bullish Relief Rally — Oversold bounce toward the EMA21/EMA55 zone from a double-bottom attempt. Trigger: close above $213 with MACD turning up and CMF above +0.05. Target: $225–$235. Invalidation: loss of $176. (25% probability)
PRICE TARGETS
Timeframe: 31 days. ATR is $16.83, so typical swings are large. The range is about 15–16% of the current price.
- Target Price: $183.00 (modestly below the current $191.06, reflecting the bearish tilt with a partial bounce offsetting the downside)
- Expected Range: $166.00 to $197.00 (width $31, about 16.2% of current price, within the 12–18% guide for 30–60 days)
- Key Levels: Support at $176.73 (Nov 5 low, then lower Bollinger Band at ~$173), Resistance at $213.41 (EMA21; interim resistance ~$200)
OVERALL BIAS
OVERALL BIAS: BEARISH - Price sits below every moving average, with a fully bearish MA stack and a death cross, a bearish MACD crossover, -DI dominating +DI, and CMF in distribution. Oversold bounces have been sold into lower highs, so more downside to test or break $176 is the most likely path over 31 days.
This is educational analysis and not financial advice.