AVGO 47-day bullish forecast — Nov 11, 2026
- Bias: Bullish
- Timeframe: 47 days (made Nov 11, 2026, target date Dec 28, 2026)
- Price at analysis: $351.96
- Price target: $368.00
- Expected range: $328.00 – $386.00
- Result: Pending — graded after the close on Dec 28, 2026
Get a free AI analysis of AVGO today
Analysis
TECHNICAL INDICATORS
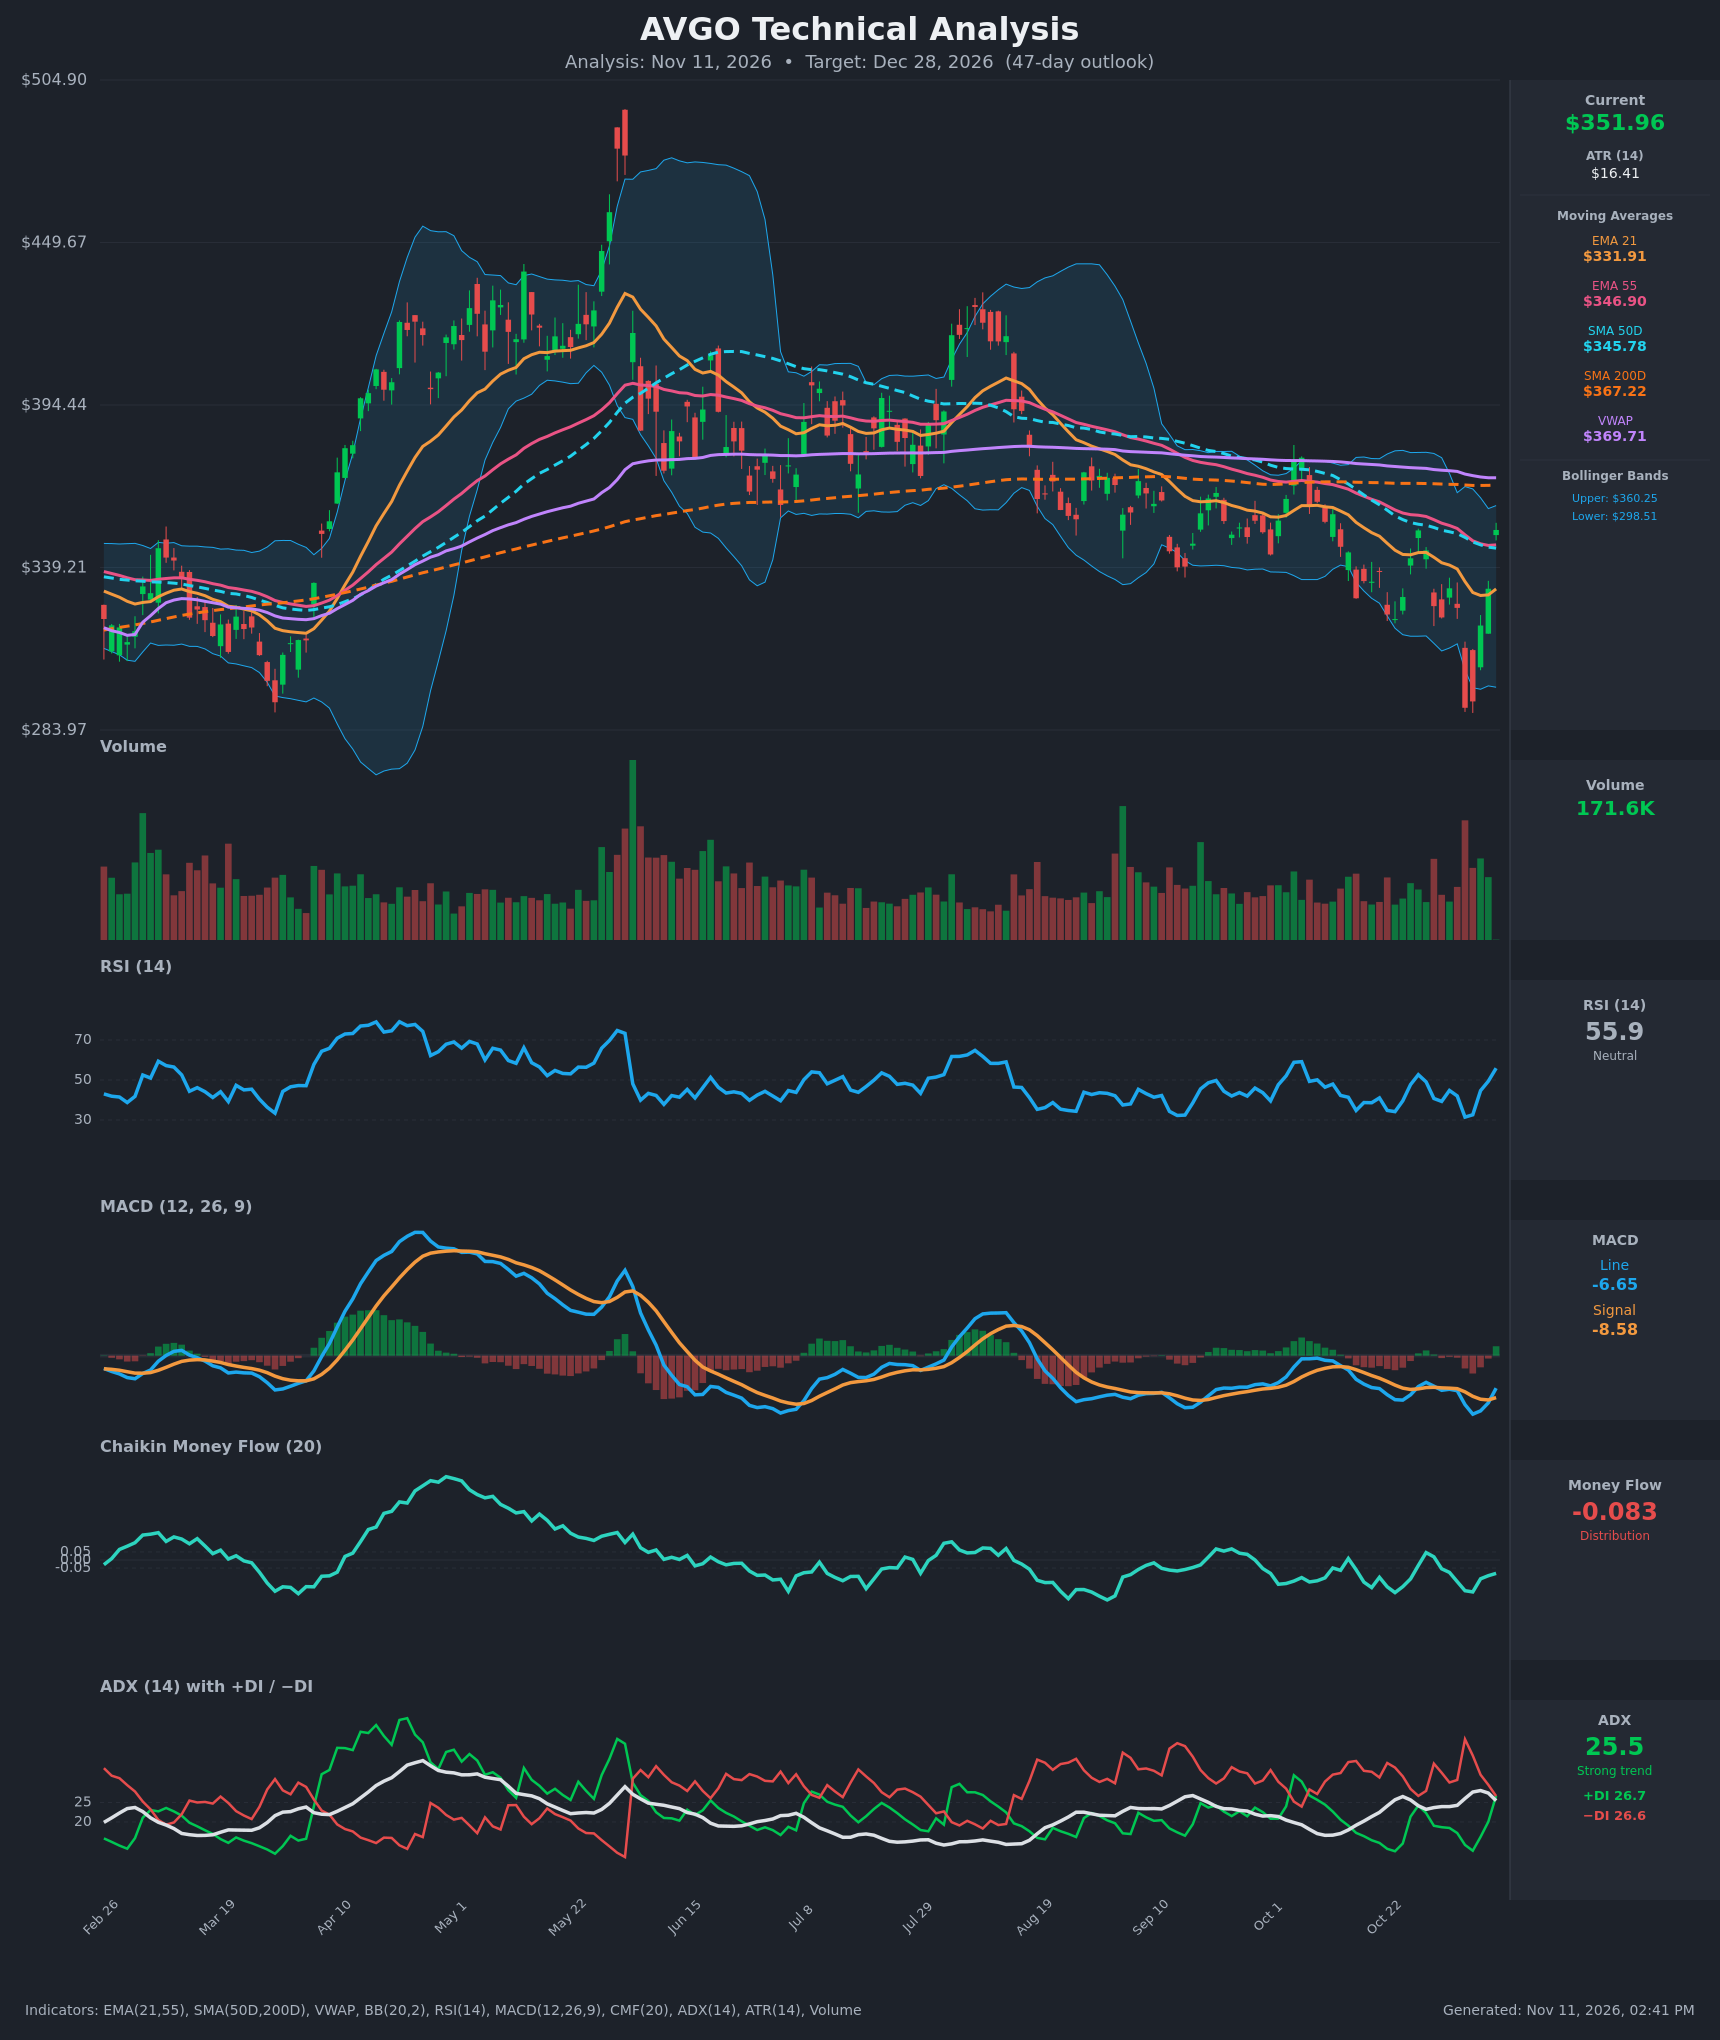
- RSI (14): 55.89, up sharply from 31.4 on Nov 5. It has moved back above the 50 midline and is still well short of overbought, so there is room to run. [Bullish]
- 20 EMA (EMA 21 = $331.91): Price at $351.96 is about 6% above the EMA21, which is now rising again after bottoming near $329.70. EMA21 is still below EMA55 ($346.90), so the bearish EMA alignment has not yet flipped, but the gap is closing quickly. [Bullish]
- MACD: Line -6.65 against signal -8.58, so the histogram is positive and a bullish crossover occurred on Nov 11 (the line was below the signal on Nov 10). Both lines are still below zero, so this is a recovery from oversold momentum, not yet a full trend change. [Bullish]
- Bollinger Bands (20): Upper $360.25, lower $298.51, midline about $329.4. Price has moved from the lower band (Nov 5 low of $291.53 pierced it) to the upper half of the bands, about $8 below the upper band. Momentum is strong, but a short-term stall near the upper band is likely. [Neutral]
- CMF (20): -0.083, below the -0.05 threshold. Money flow has been negative for most of the past several months, so the rebound has not yet been confirmed by accumulation. [Distribution]
- ADX (14): 25.5, at the "strong trend" threshold but falling from 28.1. +DI (26.7) has just crossed above −DI (26.6) for the first time since Oct 28, after −DI dominated at 35-41 during the selloff. The edge is razor thin and the bearish trend is fading. [Moderate Trend, tilting Bullish]
- Volume: 171.6K on a green bar. It is modest, not a capitulation or breakout surge, but the Nov 5-6 selloff bars were heavier and the bounce is clearly absorbing that supply. The rally is not yet backed by conviction volume. [Neutral to mildly Bullish]
DIVERGENCES & TRENDS
- Failed breakdown: Price made a low at $291.53 on Nov 5 and reclaimed $351.96 within 4 sessions (+20.7%). The MACD low (-11.96 on Nov 6) came with the price low, so there is no classic divergence, but the quick recovery shows strong dip buying.
- Long-term structure: The $500 peak in May was followed by a lower high near $425 in August and a lower high near $380 in October. The structure remains a long-term downtrend.
- Moving averages:
- SMA50D ($345.78) is below SMA200D ($367.22), so the death cross is in force.
- Price is above SMA50D, EMA55 and EMA21, but still below SMA200D ($367.22) and VWAP ($369.71).
- The $367-370 zone is a heavy resistance cluster.
- Crossovers:
- MACD line crossed above its signal on Nov 11 (bullish).
- +DI crossed above −DI on Nov 11 (bullish, marginal).
- RSI moved from 31 to 56 (bullish).
- EMA21 remains below EMA55 (still bearish, but converging).
- CMF is stuck below zero and has not confirmed the price rebound, which is a mild non-confirmation.
CHART PATTERNS
- Bullish Double Bottom (reversal): Lows near $290-295 in March/April and $291.53 on Nov 5 form an approximate double bottom. The neckline is far above, near $395-425, so this is a long-horizon target, not one for the 47-day window. A move toward the SMA200/VWAP zone ($367-370) would be the first confirmation step.
- Large descending structure (lower highs from the $500 peak): This is a longer-term bearish bias that caps rallies. A decisive close above $370 would negate it.
- Short term: A V-shaped bounce into resistance, with a possible Bullish Falling Wedge or flag base forming if price consolidates between $330 and $360.
POTENTIAL SCENARIOS
- Scenario 1: Bullish Recovery to the 200-Day Zone — The MACD and DI crossovers hold, price consolidates above the EMA55/SMA50 ($346-347), and buyers push into the SMA200/VWAP cluster. Trigger: a daily close above $360.25 (upper Bollinger Band) with rising volume. Target: $367-$385, with $368 as the base case. Invalidation: a daily close below $331.91 (EMA21). (50% probability)
- Scenario 2: Bearish Failure at Resistance — The bounce stalls at $360-370 (upper band, SMA200, VWAP), CMF stays negative, and the larger downtrend resumes. Trigger: a rejection near $367-370 followed by a close below $345.78 (SMA50/EMA55). Target: $320, then a retest of $291-300. Invalidation: a sustained close above $370. (35% probability)
- Scenario 3: Neutral Range Consolidation — Price chops between EMA21 support and the SMA200 resistance while ADX fades below 25. Trigger: repeated closes between $335 and $365. Target: $345-$360. Invalidation: a close outside the $331-$370 range. (15% probability)
PRICE TARGETS
For the 47-day horizon (target date Dec 28, 2026):
- Target Price: $368.00
- Expected Range: $328.00 to $386.00 (width $58, about 16.5% of current price, consistent with the 30-60 day guidance of 12-18%)
- Key Levels: Support at $345.78 (SMA50D, with the EMA55 at $346.90 just above it; deeper support at $331.91 EMA21), Resistance at $367.22 (SMA200D, with VWAP at $369.71 just above)
OVERALL BIAS
OVERALL BIAS: BULLISH - The MACD bullish crossover, the +DI/−DI flip, rising RSI, a reclaim of the EMA21, EMA55 and SMA50D, and a likely double-bottom base near $291 favor a move toward the $367-370 resistance cluster. Conviction is modest because CMF shows distribution and price remains below the SMA200D and VWAP, so a rejection at $367-370 is a real risk.
This is educational analysis and not financial advice.