ALAB 33-day bearish forecast — Nov 11, 2026
- Bias: Bearish
- Timeframe: 33 days (made Nov 11, 2026, target date Dec 14, 2026)
- Price at analysis: $227.47
- Price target: $212.00
- Expected range: $196.00 – $236.00
- Result: Pending — graded after the close on Dec 14, 2026
Get a free AI analysis of ALAB today
Analysis
TECHNICAL INDICATORS
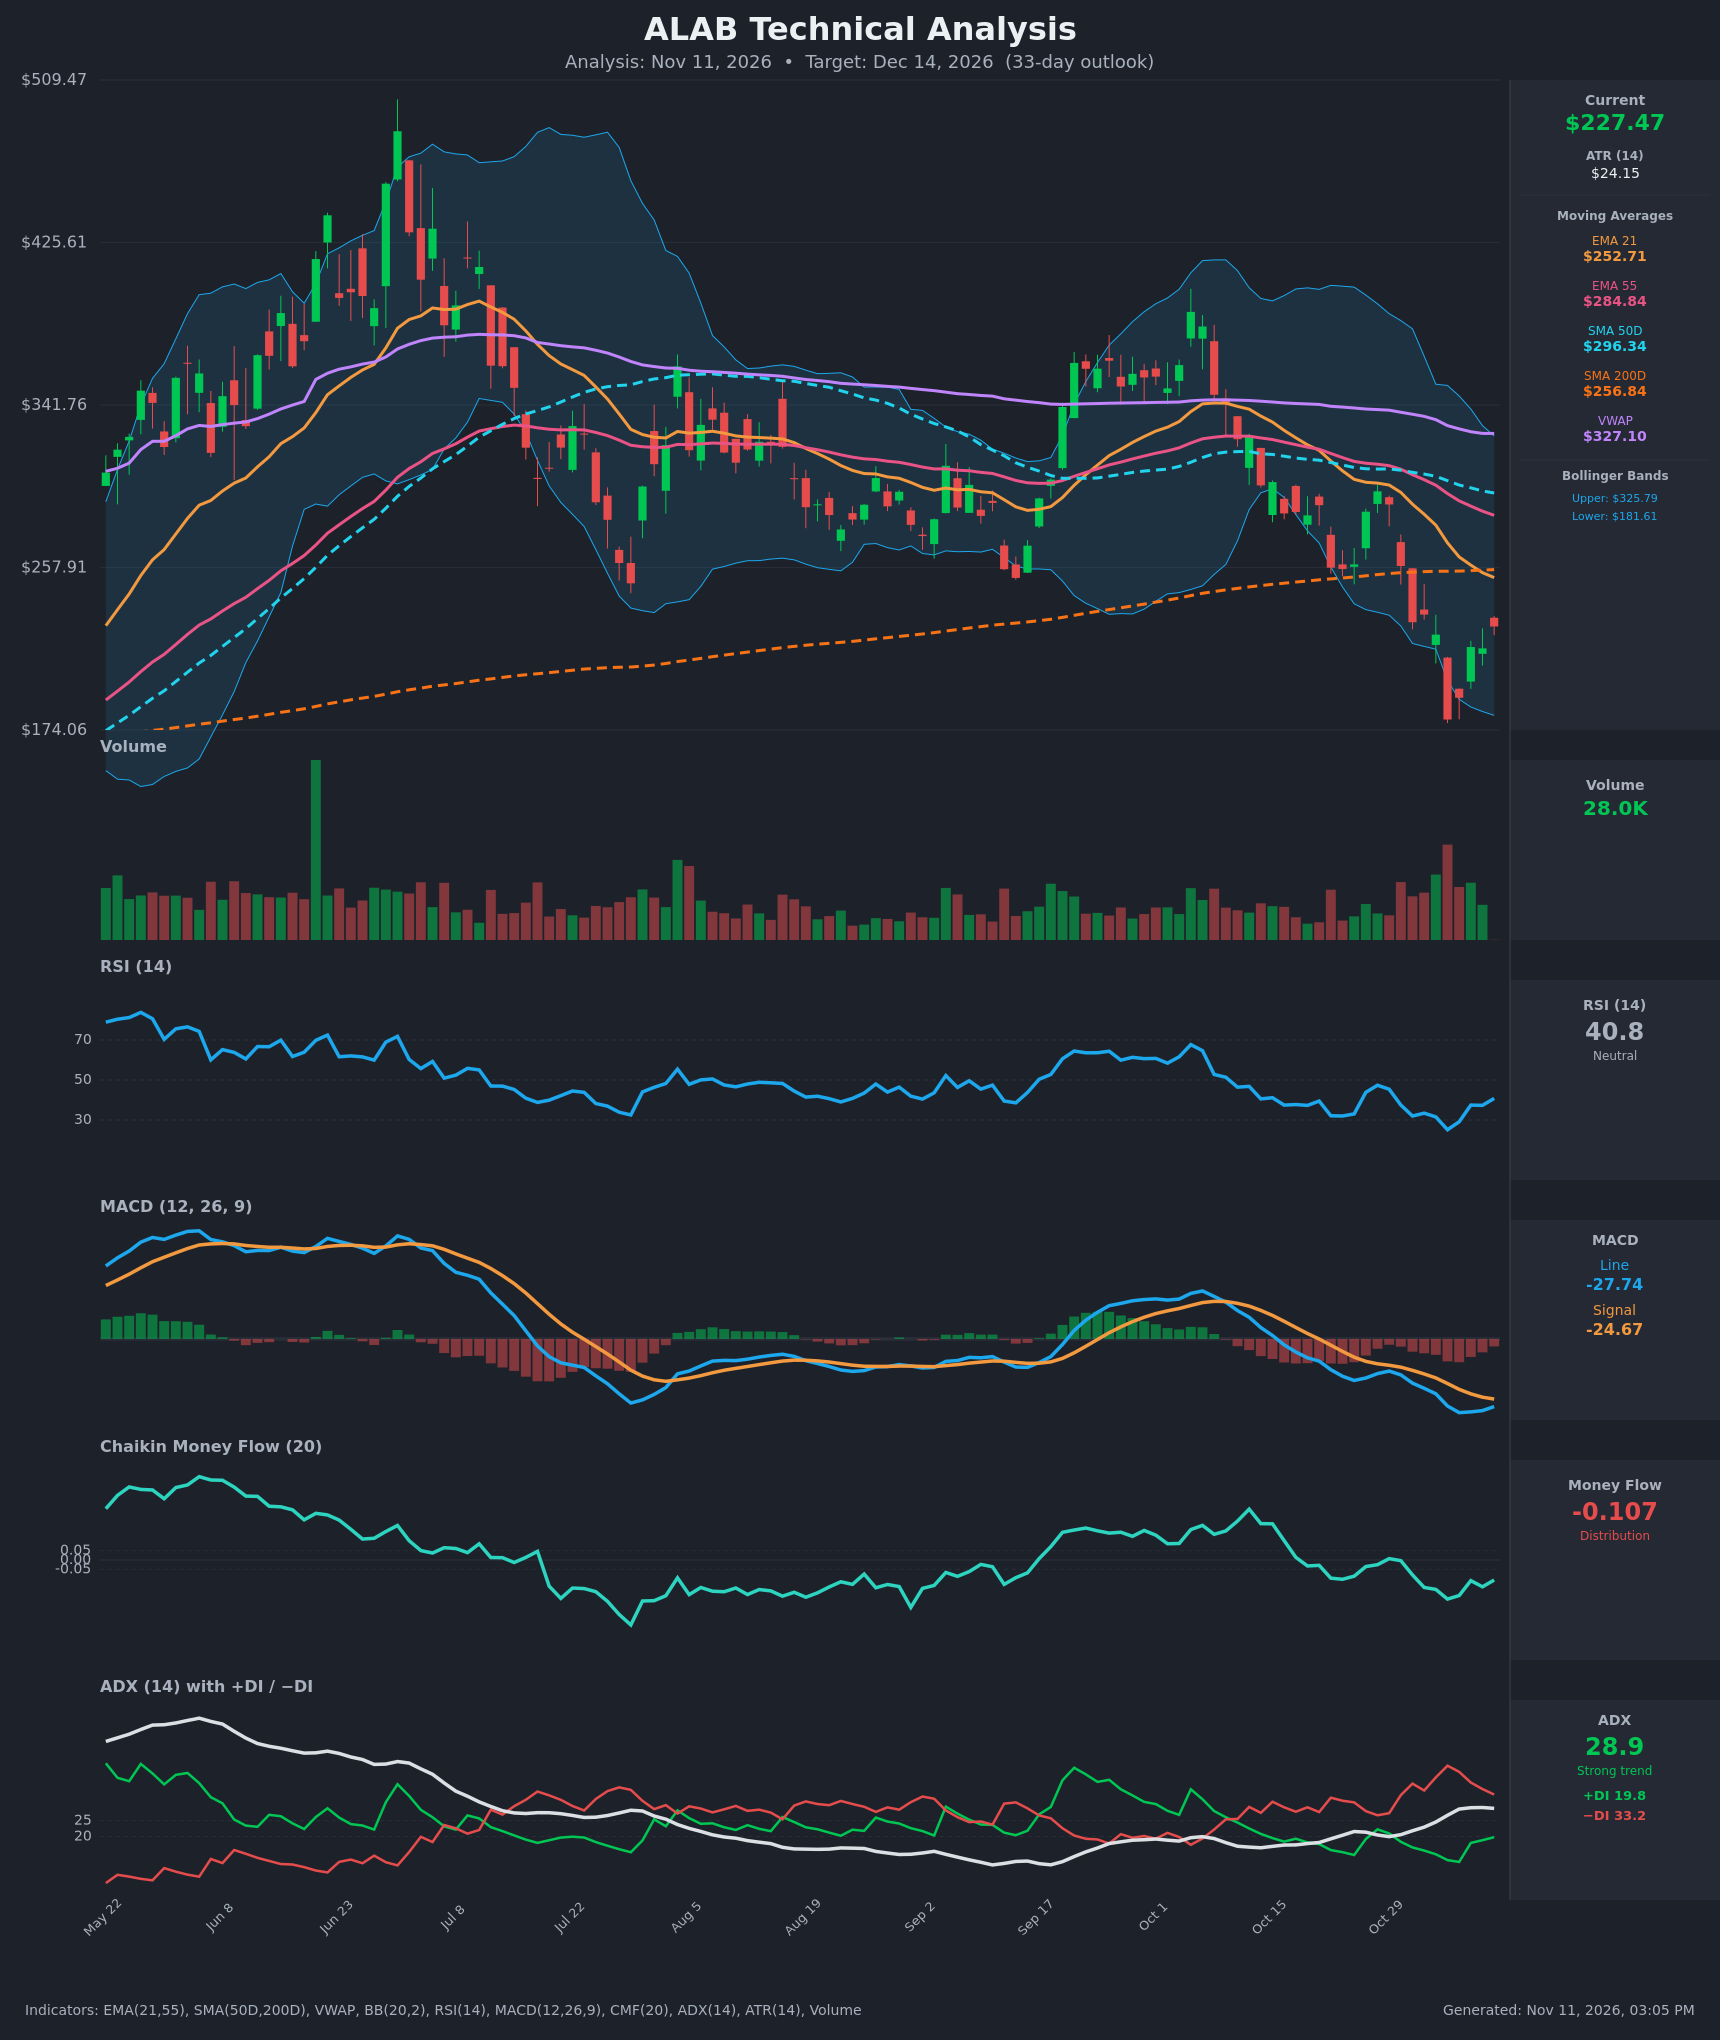
- RSI (14): 40.8, recovering from an oversold 25.1 on Nov 5 (the low reading in the table), but still below the 50 midline. The bounce has not yet turned the momentum regime, and RSI has been capped below 50 since the October breakdown. [Bearish]
- 20 EMA: The tool reports EMA 21 at $252.71. Price at $227.47 is about 10% below it, and the EMA is still falling steeply (from $312.86 on Oct 22). It acts as dynamic resistance and sits near the $256.84 SMA200. [Bearish]
- MACD: Line at -27.74, below the signal at -24.67, with a negative histogram of about -3.1. The line crossed below the signal in late October, and its recent gap has narrowed (from about -9 on Nov 6 to -3 now). Both lines are deeply negative, and no bullish crossover has formed yet. [Bearish]
- Bollinger Bands (20): Upper $325.79, lower $181.61, midline about $253.70. Price bounced off the lower band ($179.47 low on Nov 5) and sits in the lower half of the bands. Bands are wide after the volatility spike. Failure to reclaim the midline (which is near the EMA21 and SMA200 cluster) would keep the bearish bias. [Bearish]
- CMF (20): -0.107, below the -0.05 threshold and worse than the -0.003 to +0.007 readings of late October. Money flow turned negative after the Oct 30 drop and has stayed there despite the bounce. This points to distribution. [Distribution]
- ADX (14): 28.9, rising from about 19 on Oct 22 and above the 25 trend threshold. −DI (33.2) sits well above +DI (19.8), so bears are in control. +DI has recovered from 12.0 but is still far below −DI. [Strong Trend – Bearish]
- Volume: The last bar shows 28.0K, light compared with the heavy red capitulation volume around the Nov 5 breakdown. The bounce from $179 to $227 came on modest volume, which suggests a weak relief rally rather than aggressive accumulation. [Bearish/Weak Bounce]
DIVERGENCES & TRENDS
- Price vs. RSI: RSI made a clear oversold low (25.1) with the $179.47 price low, and has since turned up. This is a short-term bounce signal, not a confirmed bullish divergence.
- MACD: The histogram is contracting while the lines remain deeply negative. This suggests selling momentum is easing, but there is no bullish cross yet.
- EMA alignment: EMA21 ($252.71) < EMA55 ($284.84) < SMA50D ($296.34), with price below all of them. This is a fully bearish stack. The EMA21/EMA55 bearish crossover already happened (the EMAs were close on Oct 22 and the gap has widened since).
- SMA crossovers: The SMA50D ($296.34) is still above the SMA200D ($256.84), so there is no death cross yet. The SMA50 is falling toward the SMA200 and the gap is narrowing, so a death cross is possible in the coming weeks.
- Price vs. SMA200D: Price is below the SMA200D (about $29 below), a breakdown below long-term support. That level is now overhead resistance.
- VWAP: VWAP ($327.10) is far above price, which indicates sustained selling pressure relative to the average cost basis.
- Trend: The chart shows a lower-high structure since the Oct 1 peak near $400. The October sell-off cut through the 200-day average, and the recent rebound has been a counter-trend bounce.
CHART PATTERNS
- Bearish Flag / Bearish Pennant (continuation): After the sharp drop from about $297 to $179, the rebound to about $227 resembles a relief bounce inside a larger downtrend. A rollover from the $240–$255 zone would match the bearish flag/pennant playbook, with a measured move back toward the prior low (about $180) or lower.
- Failed support (SMA200 break): Price lost the 200-day average and the rebound is stalling beneath it. This supports the bearish continuation view.
- Possible double-bottom attempt (not confirmed): A retest of the $179–$190 area that holds on a higher low would turn this into a Bullish Double Bottom with a target near the $253 midline. This is the main alternative, but it needs confirmation.
- Targets: The bearish flag target is a retest of about $180–$195. The bullish alternative is a squeeze to $253–$257.
POTENTIAL SCENARIOS
- Scenario 1: Bearish Rejection and Retest of Lows — The relief rally fades into the falling EMA21/SMA200 zone, with −DI dominance and negative CMF keeping sellers in control. Price rolls over and retests the Nov 5 low area. Trigger: rejection at $240–$255 or a close below $216 (the recent swing low). Target: $195–$205, with an extension to $180. Invalidation: daily close above $257 (SMA200D). (50% probability)
- Scenario 2: Bullish Relief Rally — Oversold RSI and a narrowing MACD gap fuel a continued bounce, with price reclaiming the EMA21 and SMA200 area. Trigger: close above $240 with rising volume and a MACD bullish cross. Target: $253–$257, then $285 (EMA55). Invalidation: a close below $216 (the Nov 9–10 lows). (35% probability)
- Scenario 3: Neutral Chop — Price consolidates between about $205 and $245 while the indicators reset. Trigger: ADX falls and RSI stays between 40 and 50. Target: around $225–$235. Invalidation: a close beyond either range boundary. (15% probability)
PRICE TARGETS
Range width check: $236.00 − $196.00 = $40.00, which is 17.6% of $227.47. That fits the 30–60 day guidance of 12–18%.
- Target Price: $212.00 (33-day target)
- Expected Range: $196.00 to $236.00
- Key Levels: Support at $179.47, Resistance at $252.71
OVERALL BIAS
OVERALL BIAS: BEARISH - Price is below the full EMA/SMA stack including the SMA200D, MACD is negative and below its signal, −DI dominates with ADX at 28.9, and CMF shows distribution. The rebound from oversold levels looks like a low-volume relief rally likely to stall at $240–$255 resistance, though the oversold bounce keeps conviction modest.
This is educational analysis and not financial advice.