CRDO 34-day bearish forecast — Nov 15, 2026
- Bias: Bearish
- Timeframe: 34 days (made Nov 15, 2026, target date Dec 18, 2026)
- Price at analysis: $131.51
- Price target: $124.00
- Expected range: $104.00 – $145.00
- Result: Pending — graded after the close on Dec 18, 2026
Get a free AI analysis of CRDO today
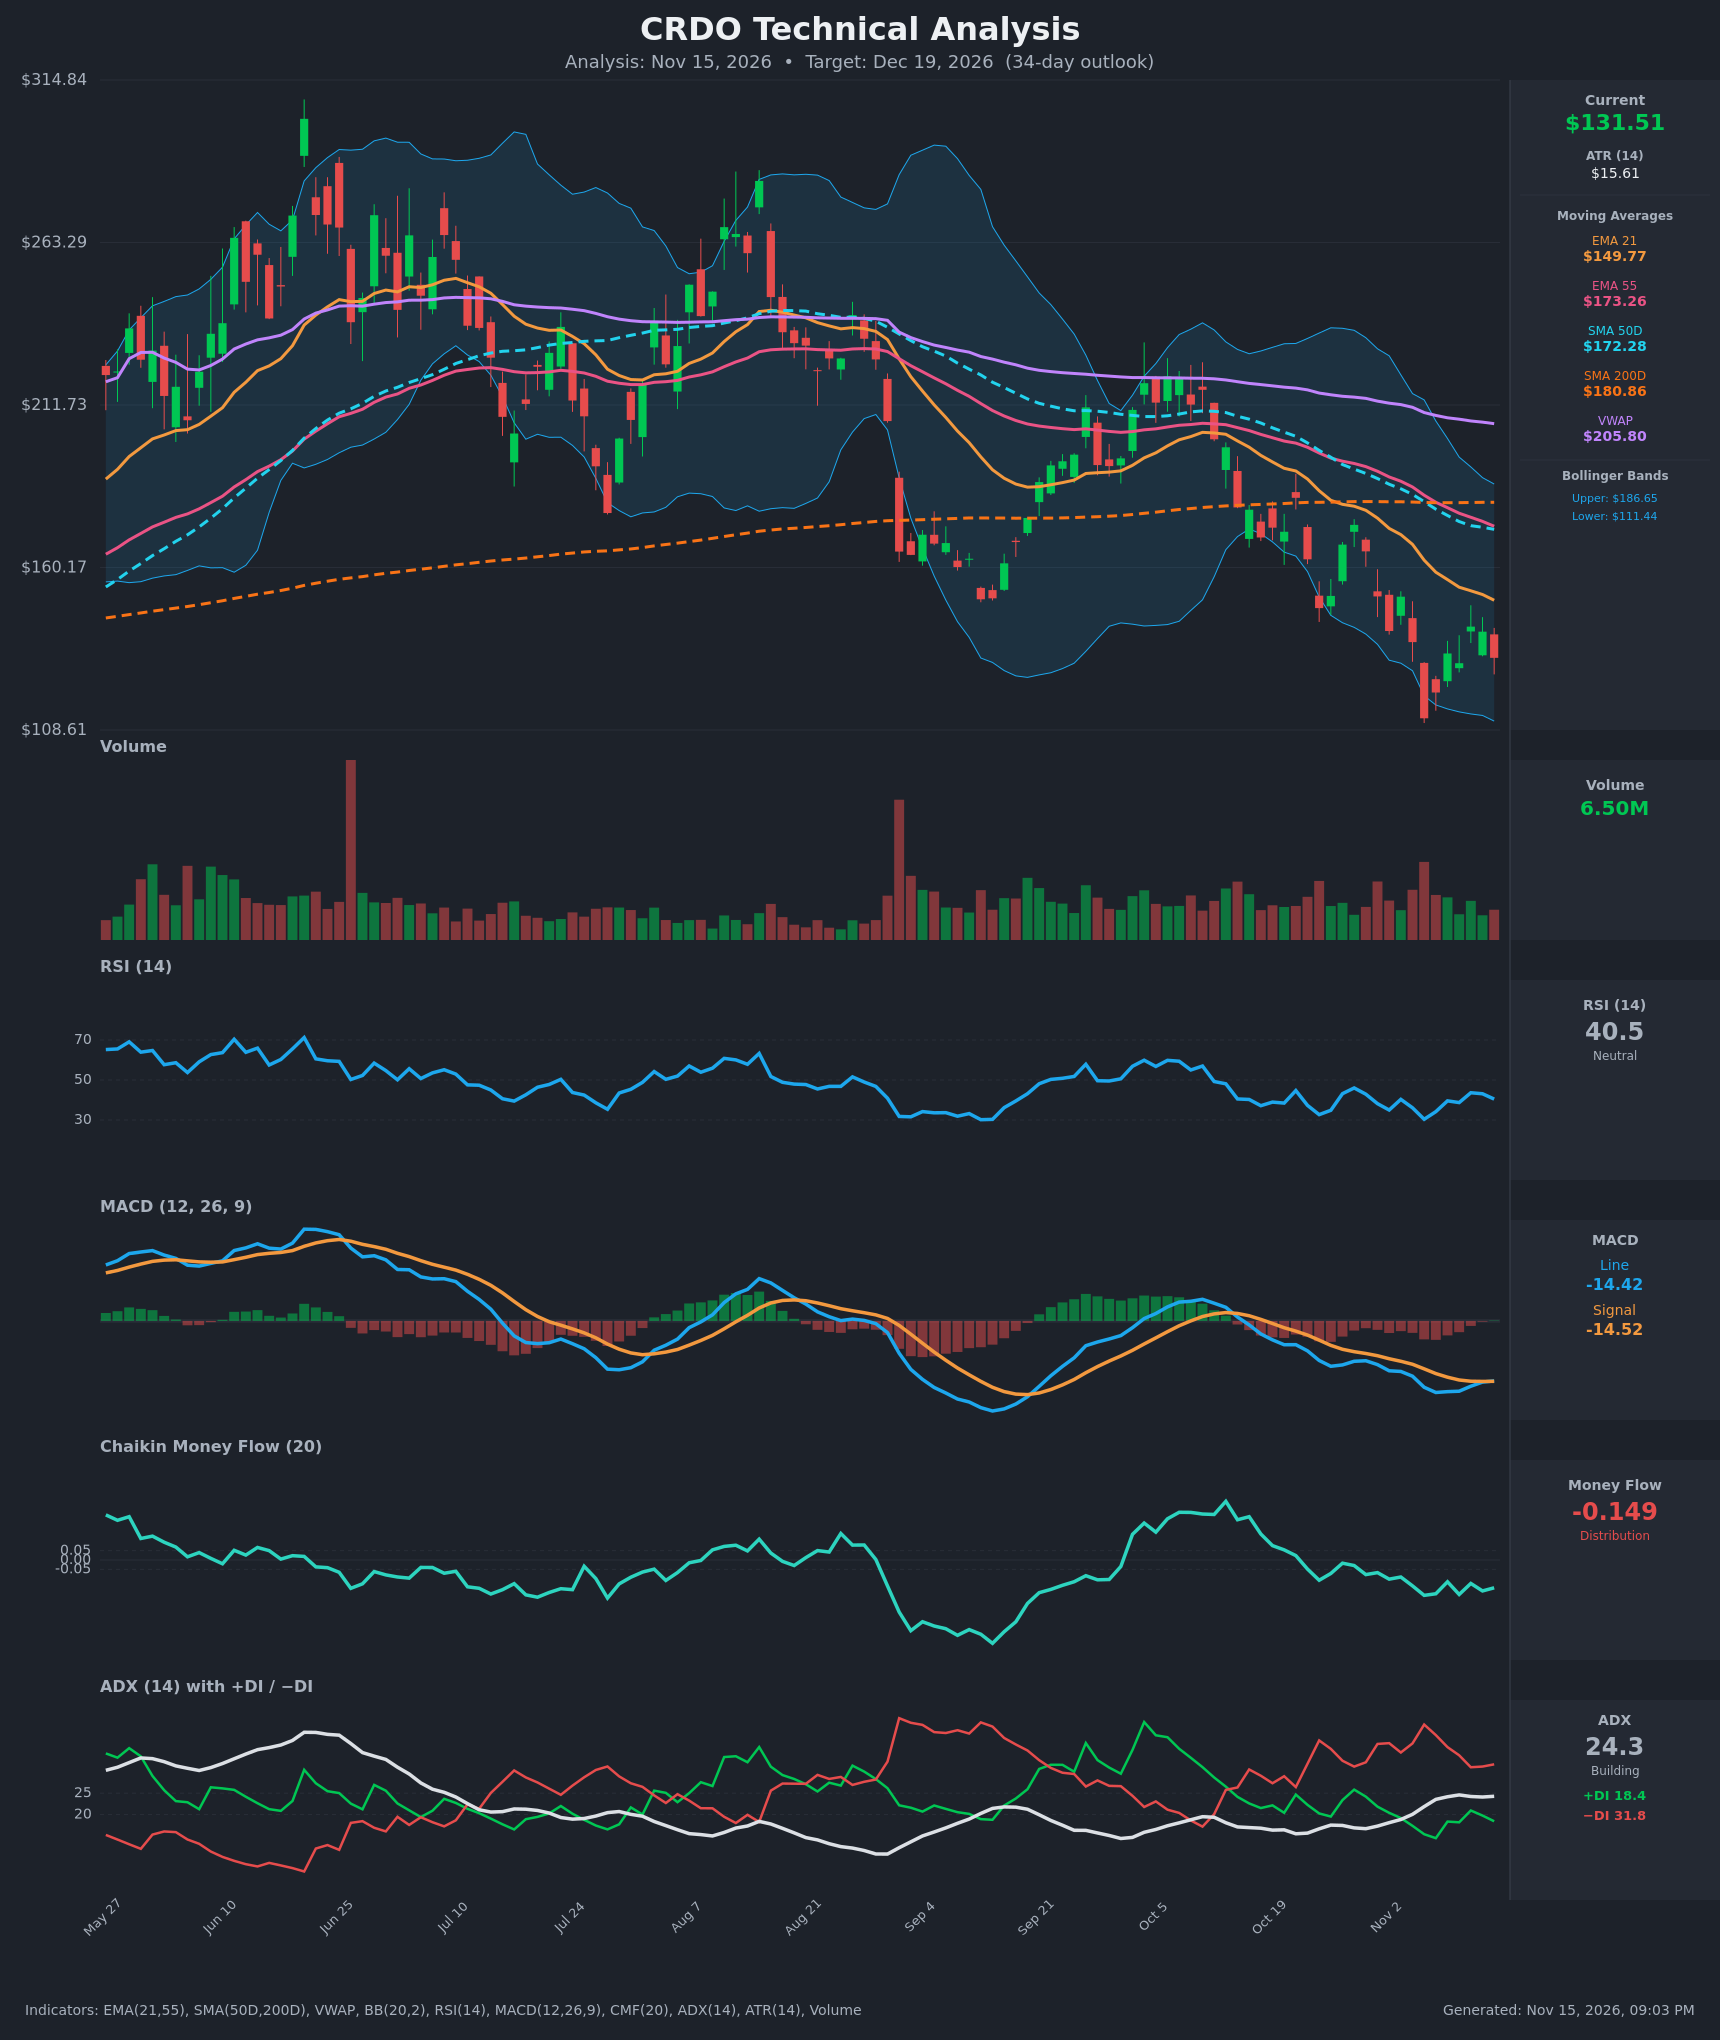
Analysis
TECHNICAL INDICATORS
- RSI (14): 40.46, below the 50 midline but above the 30 oversold zone. It bottomed at 30.4 on Nov 5 and bounced to the low 40s, but has since stalled and turned down from 43.6. Momentum is weak with no sign of a reversal. [Bearish]
- 20 EMA (EMA 21 = $149.77): Price at $131.51 is about 12% below the EMA 21, which is falling steeply (from $181 to $150 in 14 bars). It acts as overhead resistance. EMA 21 is also well below EMA 55 ($173.26), a bearish stack. [Bearish]
- MACD: Line -14.42 versus signal -14.52. The line is just barely above the signal, a marginal bullish cross with a histogram near zero. The line is deeply negative and the cross is happening at depressed levels, so it is a tentative sign of slowing downside momentum and not a confirmed reversal. [Neutral]
- Bollinger Bands (20): Upper $186.65, lower $111.44, mid about $149. Price sits in the lower third, about 27% of the way up the band. It tagged the lower band on Nov 5 ($112.33) and has bounced off it. The bands are wide, reflecting high volatility. Price is still in the "walking the lower half" regime. [Bearish]
- CMF (20): -0.149, well below -0.05 and sustained negative since mid-October. Distribution is persistent, and money flow has not turned. [Distribution]
- ADX (14): 24.3 and rising, near the 25 trend threshold. −DI at 31.8 is above +DI at 18.4, which means bears are in control. The trend is building in the downward direction. [Strong Trend – Bearish]
- Volume: 6.50M, average to slightly below average. The bounce off the Nov 5 low came on modest volume, while the Nov 5 breakdown came on a large red bar. Volume is not confirming any recovery. [Neutral to Bearish]
DIVERGENCES & TRENDS
- Potential minor bullish divergence: Price made a new low on Nov 5 ($112.33), while MACD and RSI are only modestly stretched. RSI (30.4) is similar to its September low (~30) even though price is substantially lower. This is a mild sign of seller exhaustion, though not a clean divergence.
- Moving average structure: Price is below the EMA 21, EMA 55, SMA 50D ($172.28) and SMA 200D ($180.86). A death cross has formed, with SMA 50D crossing below SMA 200D around Nov 5-6. EMA 21 is below EMA 55. This is a fully bearish long-term structure.
- VWAP: $205.80 is far above price, showing sustained selling pressure and a large overhead supply zone.
- MACD: A marginal bullish crossover (the line moving above the signal on Nov 13) with a near-zero histogram. It is the only constructive signal, and the cross is weak.
- ADX/DI: −DI has dominated +DI since mid-October, and ADX is rising toward 25. Trend strength is increasing.
- CMF: It has been persistently negative and has not improved, so there is no accumulation.
CHART PATTERNS
- Descending staircase of lower highs and lower lows from the ~$225 area in early October down to ~$112. This is a bearish trend structure, not a classic reversal pattern.
- Possible bearish flag / pennant: After the sharp drop on Nov 5, the small range-bound bounce between ~$120 and ~$141 resembles a Bearish Flag Pattern (or loose Bearish Pennant) from the continuation reference. The measured move from the Nov 5 breakdown points to a resumption of the decline, with a target around the low-$110s or below.
- Possible Bullish Double Bottom: The $112 low and the potential retest near $120-$130 could form a double bottom, but it is unconfirmed. Price would need to break above ~$141-$150 on volume.
- Key resistance levels are $141.41 (recent swing high), the EMA 21 at ~$150, and the SMA 50D/EMA 55 at ~$172-$173.
POTENTIAL SCENARIOS
- Scenario 1: Bearish Flag Breakdown / Trend Continuation — Price fails near the $141-$150 resistance (EMA 21) and rolls over, with −DI dominant, CMF in distribution, and ADX rising through 25. Trigger: close below $120 or a retest of the $112 low. Target: $105-$115, with an extension to ~$100. Invalidation: daily close above $150 (EMA 21) on rising volume. (45% probability)
- Scenario 2: Bullish Double Bottom / Relief Rally — The $112 low holds, the MACD bullish cross develops, RSI turns up from the 40 area and price grinds toward the mean. Trigger: close above $141.41 followed by a break of $150. Target: $150-$165. Invalidation: close below $112. (25% probability)
- Scenario 3: Neutral Range Consolidation — Price chops between ~$115 support and ~$145 resistance as ADX stalls below 25 and indicators flatten. Trigger: failure to break either side of the $112-$141 range. Target: $120-$140. Invalidation: close beyond either boundary. (30% probability)
PRICE TARGETS
For the 34-day timeframe, ATR of $15.61 supports a wide range, and the 30-60 day guidance of ~12-18% fits (the range below is about 21.6% to reflect the high volatility, slightly above the guide).
- Target Price: $124.00 (34-day)
- Expected Range: $104.00 to $145.00 (width $41 = ~31% of current price; this is wider than the 12-18% guide because of the elevated volatility of ~12% ATR/price, and is necessary to cover both the retest of the lows and a relief bounce to the EMA 21)
- Key Levels: Support at $112.33, Resistance at $141.41
OVERALL BIAS
OVERALL BIAS: BEARISH - Price is below all key moving averages with a death cross in place. −DI is dominant over +DI with ADX rising, CMF is in persistent distribution, and the post-breakdown bounce resembles a bearish flag. The marginal MACD cross and the Nov 5 low provide some support, so a modest decline toward the low $120s or a retest of $112 is more likely than a sustained rally.
This is educational analysis and not financial advice.