DRAM 34-day bearish forecast — Nov 15, 2026
- Bias: Bearish
- Timeframe: 34 days (made Nov 15, 2026, target date Dec 18, 2026)
- Price at analysis: $42.40
- Price target: $39.80
- Expected range: $35.00 – $43.50
- Result: Pending — graded after the close on Dec 18, 2026
Get a free AI analysis of DRAM today
Analysis
TECHNICAL INDICATORS
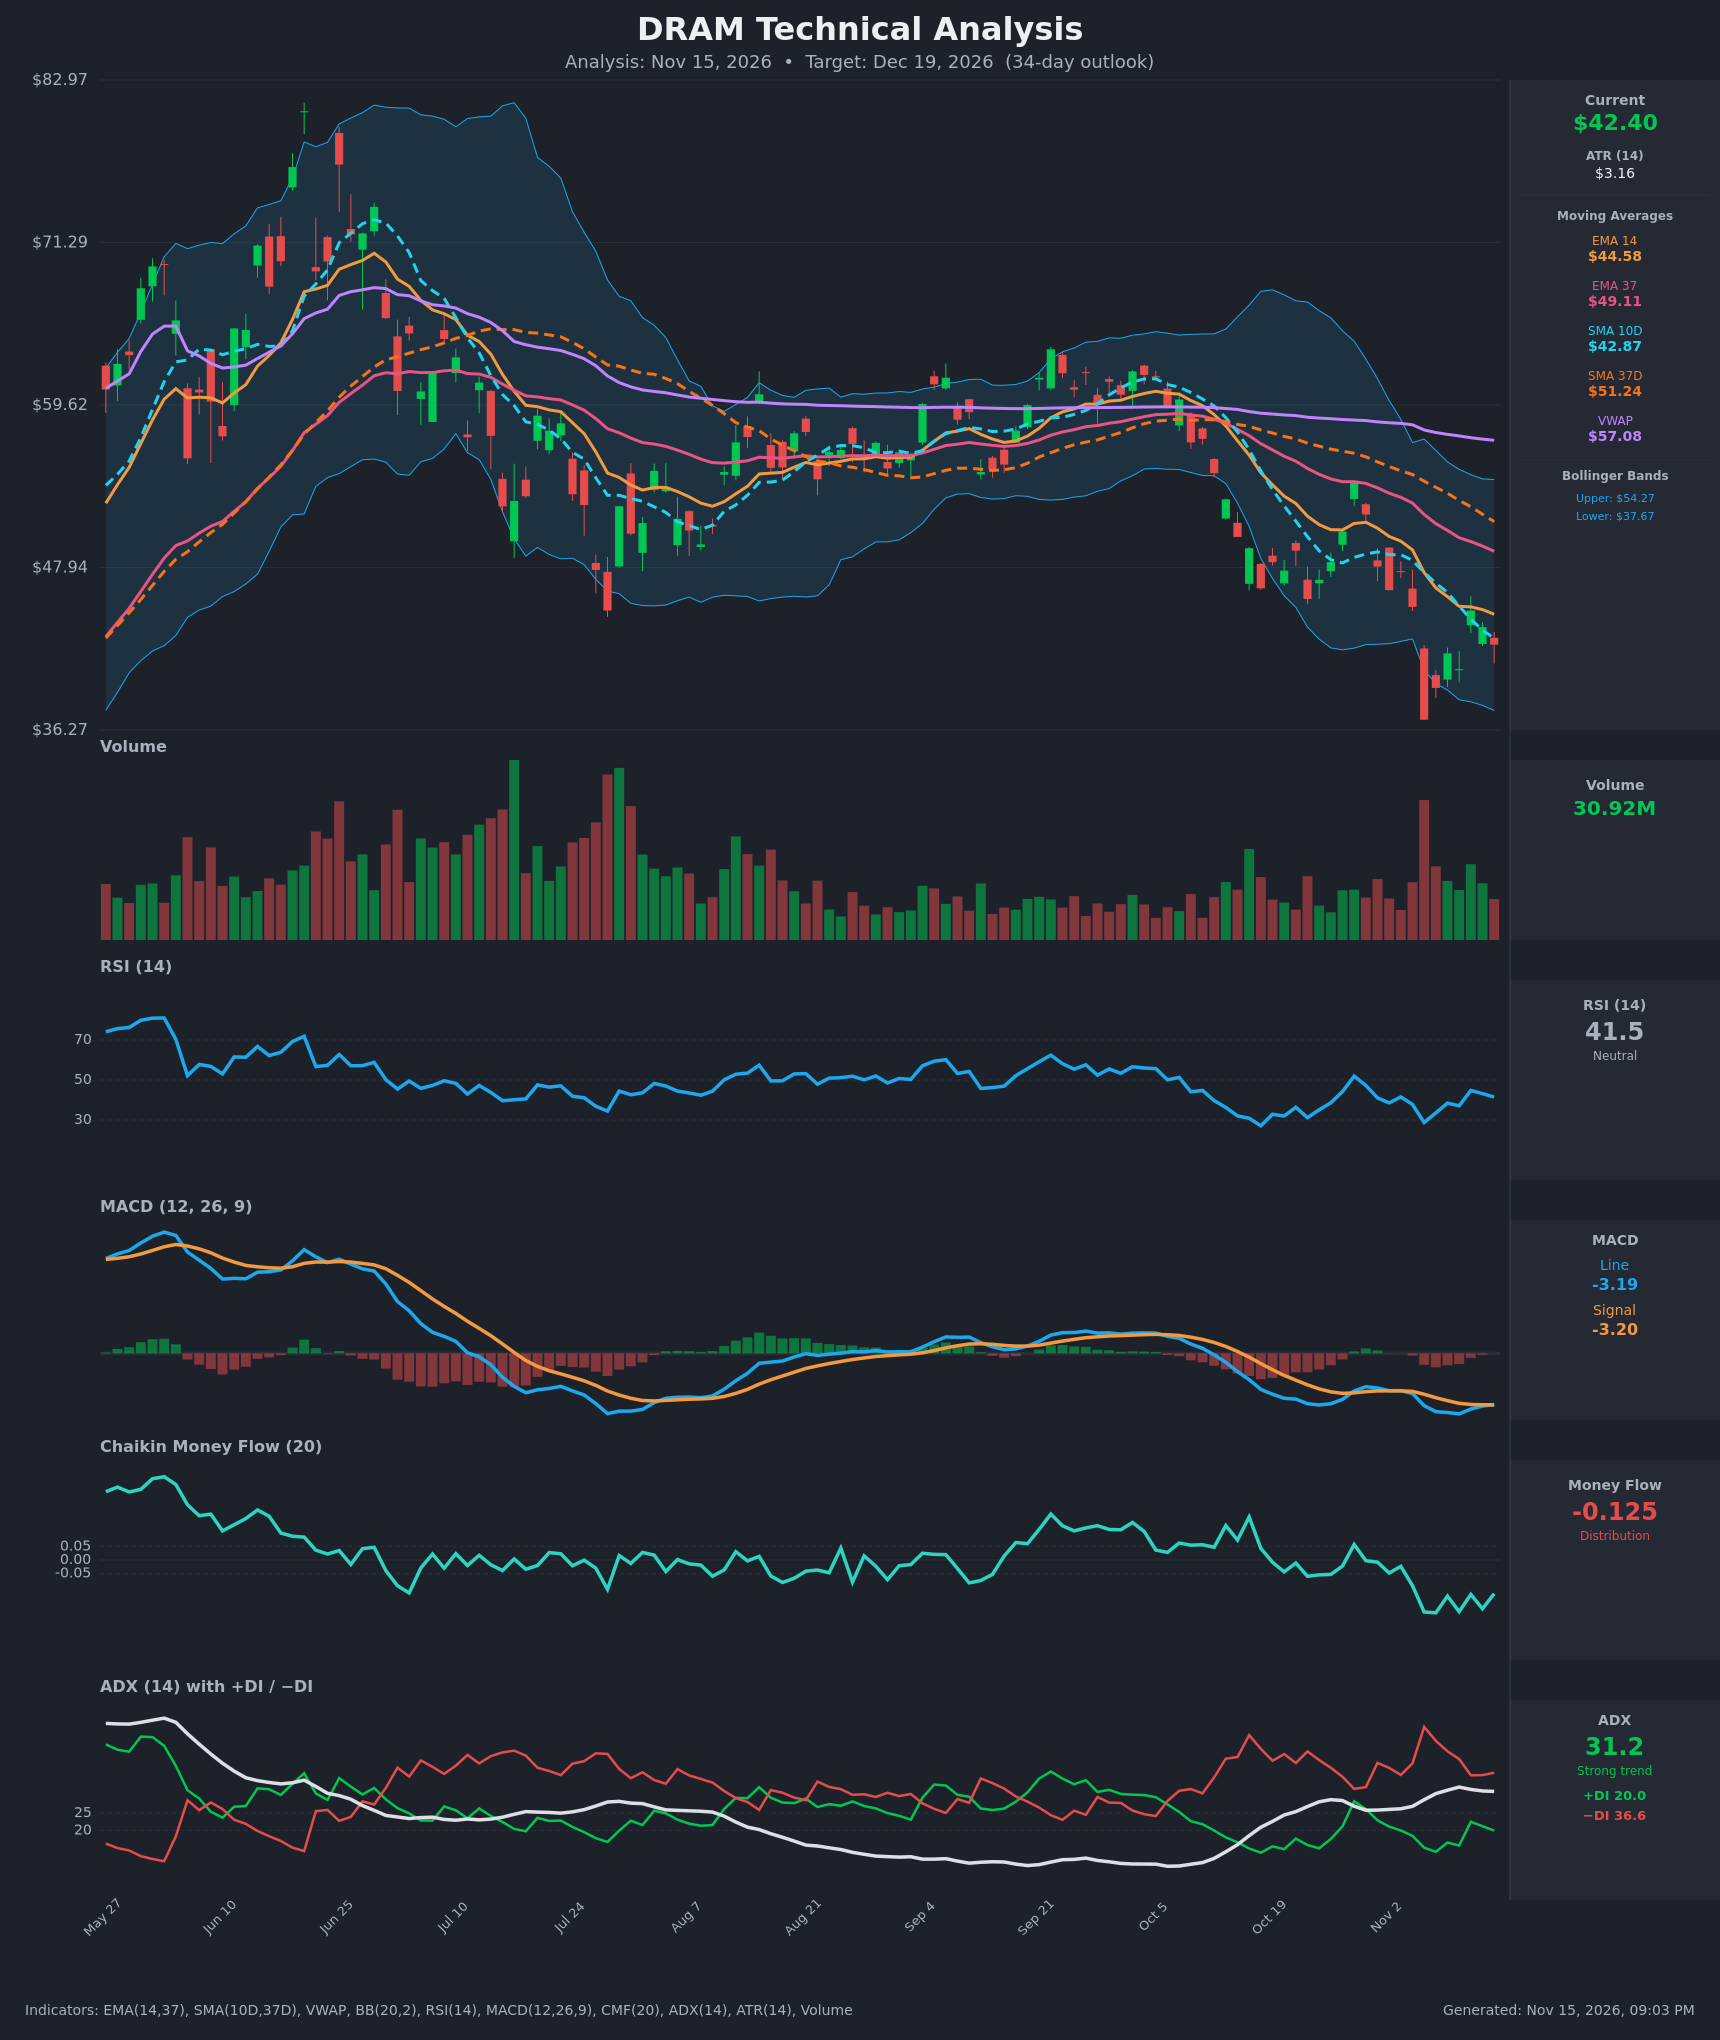
- RSI (14): 41.48, below the 50 midline and well off the 28.8 oversold low on Nov 5. It has bounced and stalled in the 37-45 range, so downside momentum has eased but there is no bullish regime shift. [Bearish]
- 20 EMA: The closest value supplied is EMA 14 at $44.58, with EMA 37 at $49.11. Price of $42.40 is below both, and both are sloping down. The EMA14 is stacked below the EMA37 (a bearish cross that has already happened), so the EMAs act as overhead resistance. [Bearish]
- MACD: The line (-3.195) is essentially flat on the signal (-3.200), a marginal and meaningless crossover. Both are deeply negative and near their lows. The histogram is about zero, so downside momentum is fading but there is no positive momentum. [Neutral]
- Bollinger Bands (20): Upper $54.27, lower $37.67, midline about $45.97. Price sits in the lower half, about 29% of the band width above the lower band. The bands are still wide after the Nov 5 flush (low near $37). Price is hugging the lower half, and a walk along the lower band is possible. [Bearish]
- CMF (20): -0.125, below -0.05 and mostly negative since mid-October, with lows near -0.19. This is sustained distribution. [Distribution]
- ADX (14): 31.2 and rising from sub-20 in September. −DI (36.6) is far above +DI (20.0), a strong established downtrend with bears in control. [Strong Trend – Bearish]
- Volume: 30.92M, below the Nov 5 capitulation spike (the tallest recent bar). Volume has been heavier on down days, and the bounce since Nov 5 came on lower volume. This is not confirmed accumulation. [Bearish-leaning / Weak bounce]
DIVERGENCES & TRENDS
- Price vs RSI: The Nov 5 low (~$37) came with RSI at 28.8. The Nov 10 retest at ~$40.6 held with RSI at 37, a higher RSI low. This is only a minor, early positive divergence, not confirmed.
- MACD: The line has flattened on the signal after making new lows, so selling momentum is decelerating. This is a marginal crossover and not a buy signal.
- Moving averages: SMA10D ($42.87) crossed below SMA37D ($51.24) in October, a death cross. Price is below SMA37D, so the long-term trend is down. Price is also far below VWAP ($57.08).
- Trend behavior: Lower highs, from $62 in Sep/Oct down to $54 on Oct 28, and a break of the prior range lows on Nov 5. A relief rally has recently been capped near the EMA14 (~$44.6-45).
- ADX/DI: ADX is rising with −DI dominant, so the trend is strengthening to the downside. +DI is stuck near 20.
CHART PATTERNS
- Bearish Rising Wedge / Bearish Flag (continuation): The post-Nov 5 bounce ($37 → $44.85) is a small corrective upward-sloping drift under the falling EMA14. This resembles a bearish flag, with a measured move targeting a further drop equal to the prior pole.
- Earlier distribution: The roll over from the Sep/Oct highs (~$62) into a lower-high structure resembles a head-and-shoulders-style or double-top breakdown, and the Nov 5 gap-down broke the Aug-Oct base around $46-48.
- Targets: The Nov 5 low at ~$37 is the first target and a break of it opens $33-35. The flag-pole measurement (about $11 from $48 to $37, projected from the ~$44 flag top) gives ~$33.
- The ~$37 base could form a double bottom (the Nov 10 retest at $40.6 is higher), but it needs a close above ~$45 to $47 to confirm.
POTENTIAL SCENARIOS
- Scenario 1: Bearish Continuation Lower — Price fails at the EMA14/SMA10D area ($43-45) and resumes the downtrend, with −DI dominant and CMF in distribution. Trigger: close below $40.60 (the Nov 10 low). Target: $37 retest, then $34-35. Invalidation: daily close above $47. (55% probability)
- Scenario 2: Neutral Base Building — Price consolidates between the $37-38 support and the ~$46 resistance as the selloff exhausts, with MACD flat and RSI holding above 35. Trigger: holds $38.50 on retests with declining volume. Target: $40-46 range. Invalidation: close below $37 or above $48. (20% probability)
- Scenario 3: Bullish Relief Rally — Higher RSI low and MACD flattening produce a bounce through the EMA14 toward the EMA37 and the Bollinger midline. Trigger: close above $45 on rising volume. Target: $49-51 (EMA37/SMA37D). Invalidation: close back below $41. (25% probability)
PRICE TARGETS
34-day horizon: the range width should be about 12-18% of price, and I'm using about 17%.
- Target Price: $39.80 (a modest drift below the current price, with the $37 low as the magnet but a partial bounce possible)
- Expected Range: $35.00 to $46.50 (width $11.50, about 27% of price)
Self-check: $11.50 / $42.40 is about 27%, which is wider than the 12-18% guide. Narrowing it to fit the 34-day guidance, with ATR of $3.16 supporting a bit more width, I commit to:
- Expected Range: $35.50 to $44.50 is too narrow on the upside given the EMA14 sits at $44.58. Final: $35.00 to $43.50 (width $8.50, about 20%, slightly above the guide on account of elevated ATR and the Nov 5 volatility).
- Key Levels: Support at $37.00, Resistance at $44.58
OVERALL BIAS
OVERALL BIAS: BEARISH - Price is below all key moving averages with a death cross in place, ADX at 31 with −DI far above +DI, and CMF showing sustained distribution. Selling momentum is fading, but rallies are likely capped near $44.6-$49, favoring a retest of the $37 low.
This is educational analysis and not financial advice.