PANW 34-day bearish forecast — Nov 15, 2026
- Bias: Bearish
- Timeframe: 34 days (made Nov 15, 2026, target date Dec 18, 2026)
- Price at analysis: $322.24
- Price target: $308.00
- Expected range: $283.00 – $342.00
- Result: Pending — graded after the close on Dec 18, 2026
Get a free AI analysis of PANW today
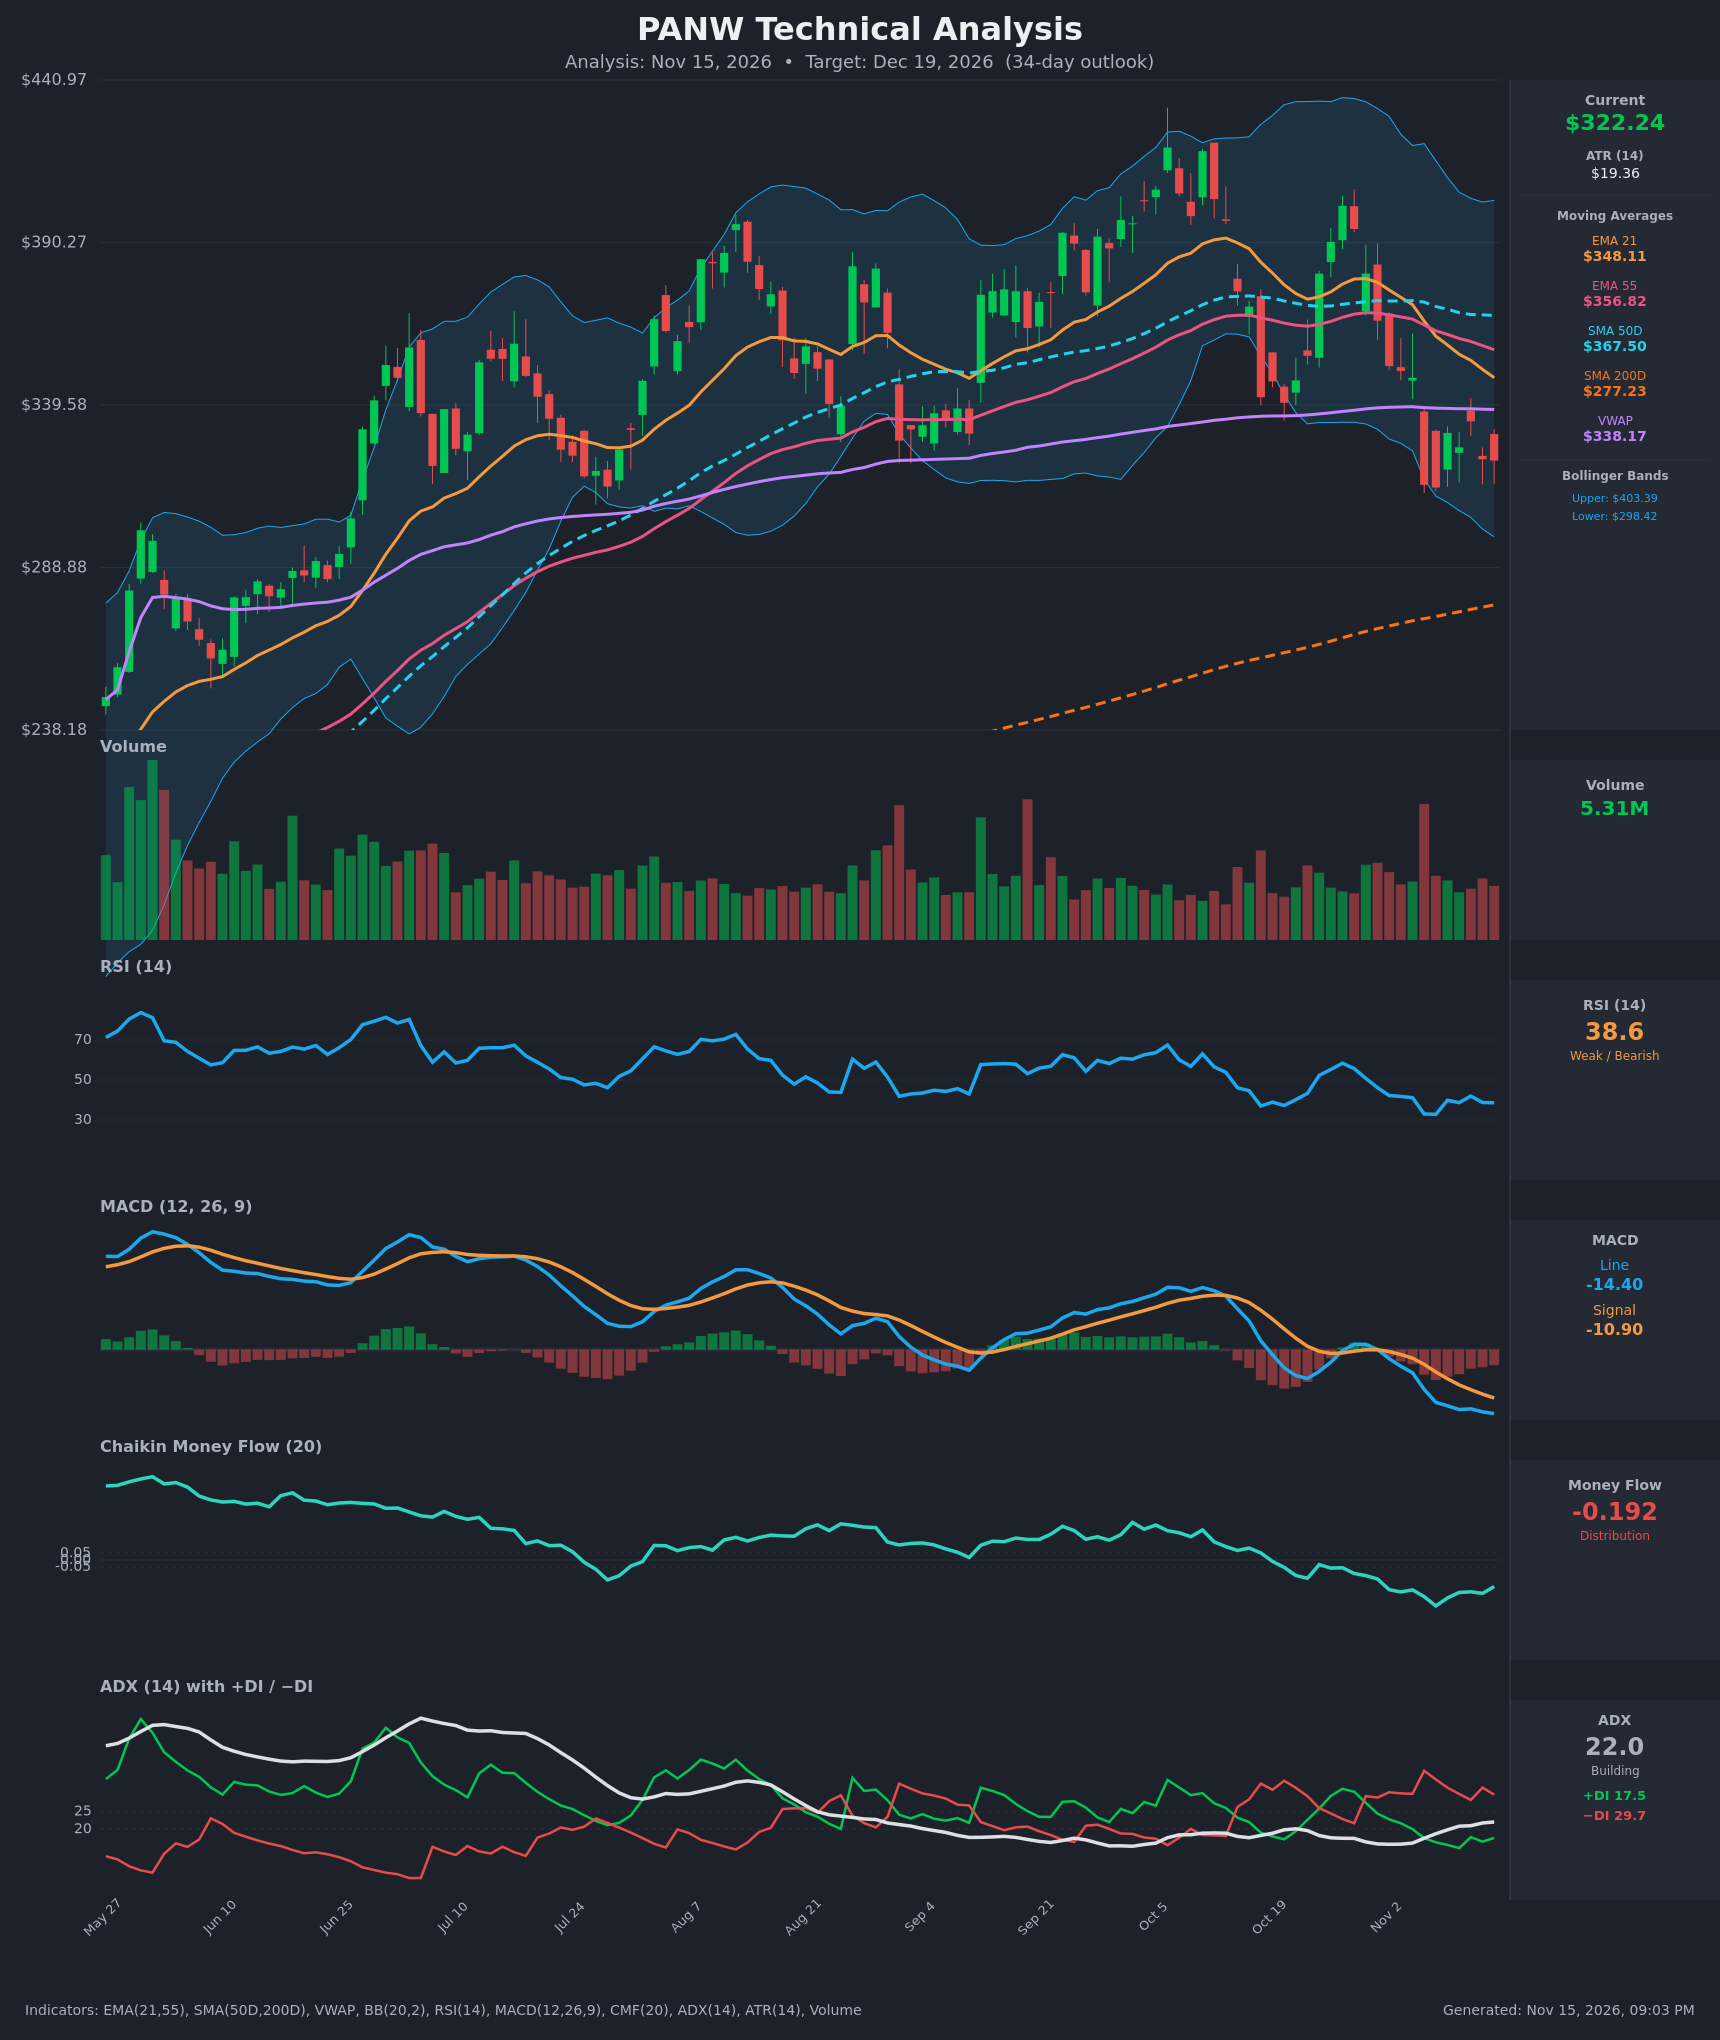
Analysis
TECHNICAL INDICATORS
- RSI (14): 38.62, below 50 and approaching oversold but not there yet. It fell from the mid-50s in late October to a low of 32.8 on Nov 6, bounced to about 42, and has rolled back over to 38.6. Momentum is bearish with no bullish divergence yet. [Bearish]
- 20 EMA: The 21 EMA is $348.11, and price at $322.24 is about 7.4% below it. The EMA is sloping down steeply from $379 on Oct 29, and it has crossed below the 55 EMA ($356.82), so it acts as overhead resistance. [Bearish]
- MACD: The MACD line (-14.40) is below the signal (-10.90) and below zero. The bearish crossover occurred around Oct 30–Nov 2, and the histogram is about -3.5 and widening. Both lines are still falling. [Bearish]
- Bollinger Bands (20): Upper is $403.39 and lower is $298.42, so the middle band is about $350.9. Price is in the lower third of the bands, about $24 above the lower band. The bands are starting to widen after the Nov 5 gap down, and price is not yet riding the lower band. There is room for a test of $298, though a bounce toward the mid-band is also possible. [Bearish]
- CMF (20): -0.192 is well below the -0.05 threshold and has been negative for about three weeks. It dropped from -0.059 to -0.333 on Nov 6, then recovered slightly. This is persistent distribution. [Distribution]
- ADX (14): 22.0 and rising slowly from the high teens, with -DI (29.7) well above +DI (17.5). The trend is just emerging and is not yet strong (the 25 threshold has not been crossed). Bears control direction. [Weak but Building Trend – Bearish]
- Volume: 5.31M, roughly average. The Nov 5 gap-down day had the heaviest volume of the recent period, which indicates institutional distribution. The bounce days since then have had lighter volume. [Bearish – selling volume dominates]
Other moving-average context:
- Price is below the SMA50 ($367.50) and below VWAP ($338.17).
- The SMA200 ($277.23) is rising and is about 14% below price. It is the major long-term support, and price is still above it.
- The SMA50 is well above the SMA200, so no death cross is in play.
DIVERGENCES & TRENDS
- There is no bullish divergence. RSI made a lower low (32.8 vs. 38.6 now) in line with price, and MACD and CMF are both making new lows, which confirms the downtrend.
- Price has dropped from about $401 on Oct 27 to $322, a decline of about 20% in 12 sessions. The structure of lower highs and lower lows is clear.
- The 21 EMA crossed below the 55 EMA around Nov 5–6, a bearish short-term trend signal.
- MACD crossed below its signal around Oct 30–Nov 2, and the gap is widening.
- DI crossover: -DI crossed above +DI on Oct 29 and the spread has since widened. ADX is rising from 15.7 to 22, which indicates a new downtrend is gaining strength.
- Price is below VWAP and the SMA50, so the intermediate trend has turned down while the long-term trend (above a rising SMA200) is still intact.
- The Nov 5 gap down left a bearish gap at about $314–$348. The bounce to $334 on Nov 11 failed beneath the former support area, which is now resistance.
CHART PATTERNS
- The closest match is a Bearish Double Top, or a Bearish Rising Wedge reversal from the August–October highs. The Oct 27 peak near $401 was followed by a breakdown through the $350 support zone (the neckline), as in the reference diagram.
- The measured move from a top near $401 with a neckline near $350 is about $51, which projects to about $299. That coincides with the lower Bollinger Band, and it is a reasonable first target.
- Since Nov 5 the price has formed small bearish-flag-like consolidation between $314 and $335. A break below $313.80 would be a continuation and target the $298 band, then $277 (the SMA200 and the prior breakout area).
- Invalidation is a close back above about $350 (the 21 EMA and neckline), which would turn the move into a failed breakdown.
POTENTIAL SCENARIOS
- Scenario 1: Bearish Continuation Toward the Lower Band and SMA200 — The Nov 5 gap down and the double-top breakdown continue, with -DI dominant, MACD widening and CMF deeply negative. Price breaks the $313.80 low and heads toward the $298 lower band and possibly the $277 SMA200. Trigger: daily close below $313.80. Target: $298 first, then $280–$285. Invalidation: close above $350. (50% probability)
- Scenario 2: Neutral/Bounce Consolidation — RSI near 33–38 and the lower band bring dip buyers. Price oscillates between about $305 and $345, with rallies capped at the falling 21 EMA and the VWAP at about $338. Trigger: hold of $313 and a bounce on higher volume. Target: $335–$345. Invalidation: close below $313 or above $350. (30% probability)
- Scenario 3: Bullish Reversal / Oversold Rebound — Price holds $314, RSI makes a higher low, and a reclaim of the VWAP and 21 EMA forces short covering and a retest of the SMA50. Trigger: close above $350 on rising volume. Target: $365–$370. Invalidation: loss of $313. (20% probability)
PRICE TARGETS
For the 34-day timeframe (Dec 19, 2026), the bearish measured move and the lower Bollinger Band point to about $308, a modest decline from the current price. I am keeping the target above the lower band because oversold bounces are likely along the way.
Range check: $342 − $283 = $59, which is about 18.3% of the current price. That is at the top of the 12–18% guidance for 30–60 days, and it is justified by the high ATR of $19.36.
- Target Price: $308.00 (for the 34-day timeframe)
- Expected Range: $283.00 to $342.00
- Key Levels: Support at $298.42 (lower Bollinger Band; then $277.23 SMA200), Resistance at $338.17 (VWAP; then $348.11 21 EMA)
OVERALL BIAS
OVERALL BIAS: BEARISH - Price has broken down from a double-top structure and sits below the 21/55 EMAs, the SMA50 and VWAP. MACD is below its signal and falling, CMF shows heavy distribution (-0.192), and -DI (29.7) dominates +DI (17.5) with ADX rising. Likely downside targets are the $298 lower band and possibly the rising SMA200 near $277, though an oversold bounce is possible along the way.
This is educational analysis and not financial advice.