PODD 34-day bullish forecast — Nov 15, 2026
- Bias: Bullish
- Timeframe: 34 days (made Nov 15, 2026, target date Dec 18, 2026)
- Price at analysis: $152.48
- Price target: $157.50
- Expected range: $146.00 – $168.50
- Result: Pending — graded after the close on Dec 18, 2026
Get a free AI analysis of PODD today
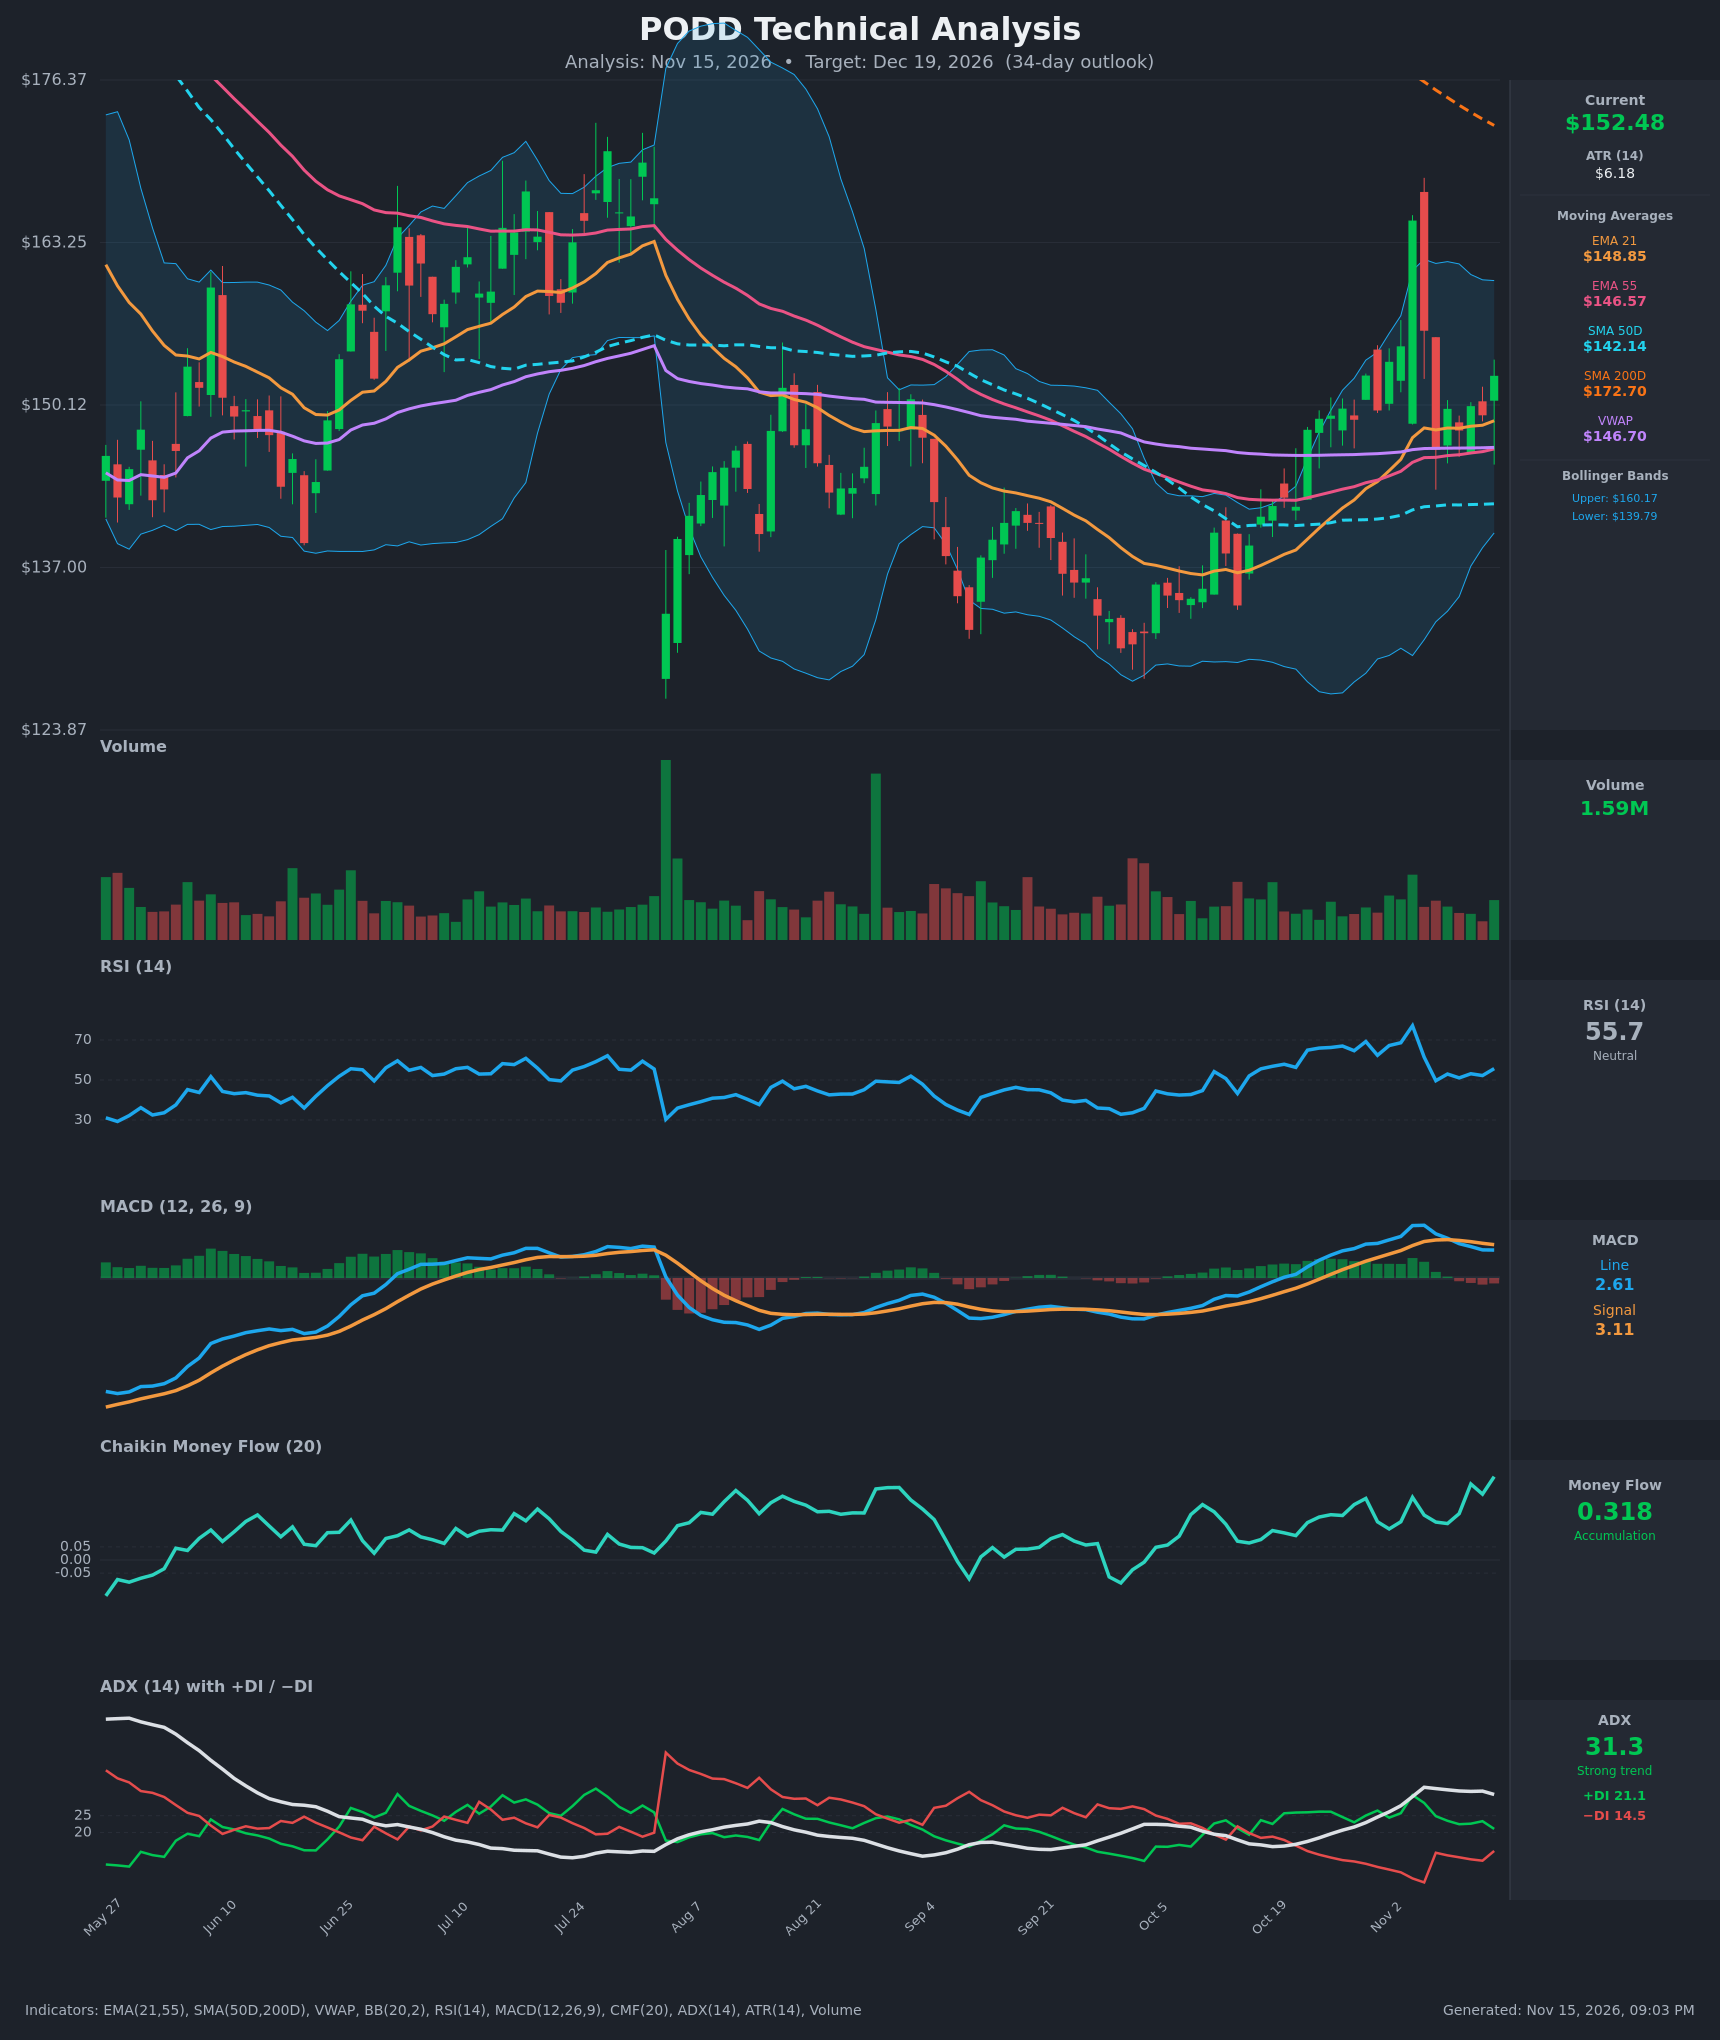
Analysis
TECHNICAL INDICATORS
- RSI (14): 55.69, down from the 77.1 spike on Nov 4 and stabilizing in the 50-55 zone, with a small uptick over the last two sessions. Momentum has reset from overbought without breaking below 50. [Bullish]
- 20 EMA (EMA 21 = $148.85): Price at $152.48 is above the EMA 21 ($148.85), EMA 55 ($146.57), SMA 50D ($142.14) and VWAP ($146.70). The EMA 21 has been above the EMA 55 since early November, and the gap is widening slightly. The EMA 21 is the first dynamic support. [Bullish]
- MACD: Line 2.608 is below Signal 3.111, and the histogram is slightly negative (about -0.50). The bearish crossover happened around Nov 10. Both lines are still positive but rolling over, which points to short-term momentum cooling. [Bearish]
- Bollinger Bands (20): Upper $160.17, lower $139.79, midline about $150. Price is just above the midline, in the upper half of the bands. The bands are wide after the Nov 4 spike, which suggests elevated volatility with room to move either way. [Neutral]
- CMF (20): 0.318, well above +0.05 and near the top of its six-month range. It has been positive for weeks and is rising, even through the Nov 4-6 reversal. That shows strong accumulation and dip buying. [Accumulation]
- ADX (14): 31.3 (strong trend), with +DI 21.1 above −DI 14.5. ADX has risen from about 20 to above 30 and is flattening. The trend is bullish, but the DI spread has narrowed from 31 vs. 6 on Nov 4. [Strong Trend – Bullish]
- Volume: 1.59M, near average. The Nov 4 spike came on heavy volume, and the pullback since has been on lighter volume. That is a constructive consolidation, though recent up days lack strong volume expansion. [Neutral-to-Bullish]
DIVERGENCES & TRENDS
- MACD is making a bearish crossover and a lower high while price holds near $150-153. This is a mild short-term momentum divergence and suggests consolidation rather than an immediate breakout.
- CMF is rising to new highs while price is flat to lower than the Nov 4 spike. This is a bullish divergence, since volume-weighted buying is outpacing price.
- RSI is holding above 50 on the pullback, which is a trend-supportive reading.
- There was no death cross or golden cross. The SMA 50D ($142.14) remains well below the SMA 200D ($172.70), so the long-term structure is still bearish. The SMA 200D has fallen from $181 to $172.70 and is converging toward price.
- Price is below the SMA 200D, so the long-term trend is down, but price has recovered from the $132-134 lows and the medium-term trend is now up.
- The Nov 4 spike to $165 and the reversal back to $146.51 on Nov 6 was a sharp rejection. The spike high at about $165 is overhead supply.
CHART PATTERNS
- Bullish Double Bottom (reversal): The September and October lows near $132-134 form a double bottom, and price has since recovered above the $150 neckline area. The measured move is roughly $150 + ($150 − $133) ≈ $167.
- Bullish Pennant / Flag (continuation): After the sharp Nov 4 spike, price is consolidating in a narrowing range of about $146-156 with higher lows. A breakout above about $156 targets the $160-165 spike high.
- Failure risk: a close below $146 would invalidate the pennant. A move below $142 (SMA 50D) would turn it into a failed-recovery pattern.
POTENTIAL SCENARIOS
- Scenario 1: Bullish Pennant Breakout — Strong CMF, positive DI spread and higher lows support a break out of the consolidation, with the double-bottom measured move pointing toward the spike high. Trigger: daily close above ~$156 on rising volume. Target: $160-165, with a stretch toward $167. Invalidation: close below $146.50. (50% probability)
- Scenario 2: Neutral Range Consolidation — The MACD bearish crossover and the overhead SMA 200D keep price grinding between the EMAs and the upper Bollinger Band. Trigger: repeated failures at $156-160 and holds at $147-149. Target: $147-157. Invalidation: close outside $145-160. (25% probability)
- Scenario 3: Bearish Failed Recovery — The MACD rolls over further, the Nov 4 rejection proves to be a lower high, and price loses the EMA cluster. Trigger: close below $146.50 (EMA 55/VWAP). Target: $142 (SMA 50D), then $139.80 (lower Bollinger Band). Invalidation: reclaim of $153-156. (25% probability)
PRICE TARGETS
- Target Price: $157.50 (34-day)
- Expected Range: $146.00 to $168.50 (width $22.50, about 14.8% of current price, consistent with the 30-60 day guidance)
- Key Levels: Support at $146.57 (EMA 55 / VWAP cluster; EMA 21 at $148.85 is the first minor support), Resistance at $160.17 (upper Bollinger Band; the Nov 4 swing high near $165 is next)
OVERALL BIAS
OVERALL BIAS: BULLISH - Strong accumulation (CMF 0.318), ADX above 30 with +DI over −DI, and price above all key short- and medium-term averages. The constructive post-spike consolidation and the double-bottom/pennant structures favor a move toward $157-165. The MACD bearish crossover and the falling SMA 200D overhead limit conviction.
This is educational analysis and not financial advice.