NVDL 34-day bullish forecast — Nov 15, 2026
- Bias: Bullish
- Timeframe: 34 days (made Nov 15, 2026, target date Dec 18, 2026)
- Price at analysis: $17.83
- Price target: $19.20
- Expected range: $16.40 – $19.60
- Result: Pending — graded after the close on Dec 18, 2026
Get a free AI analysis of NVDL today
Analysis
TECHNICAL INDICATORS
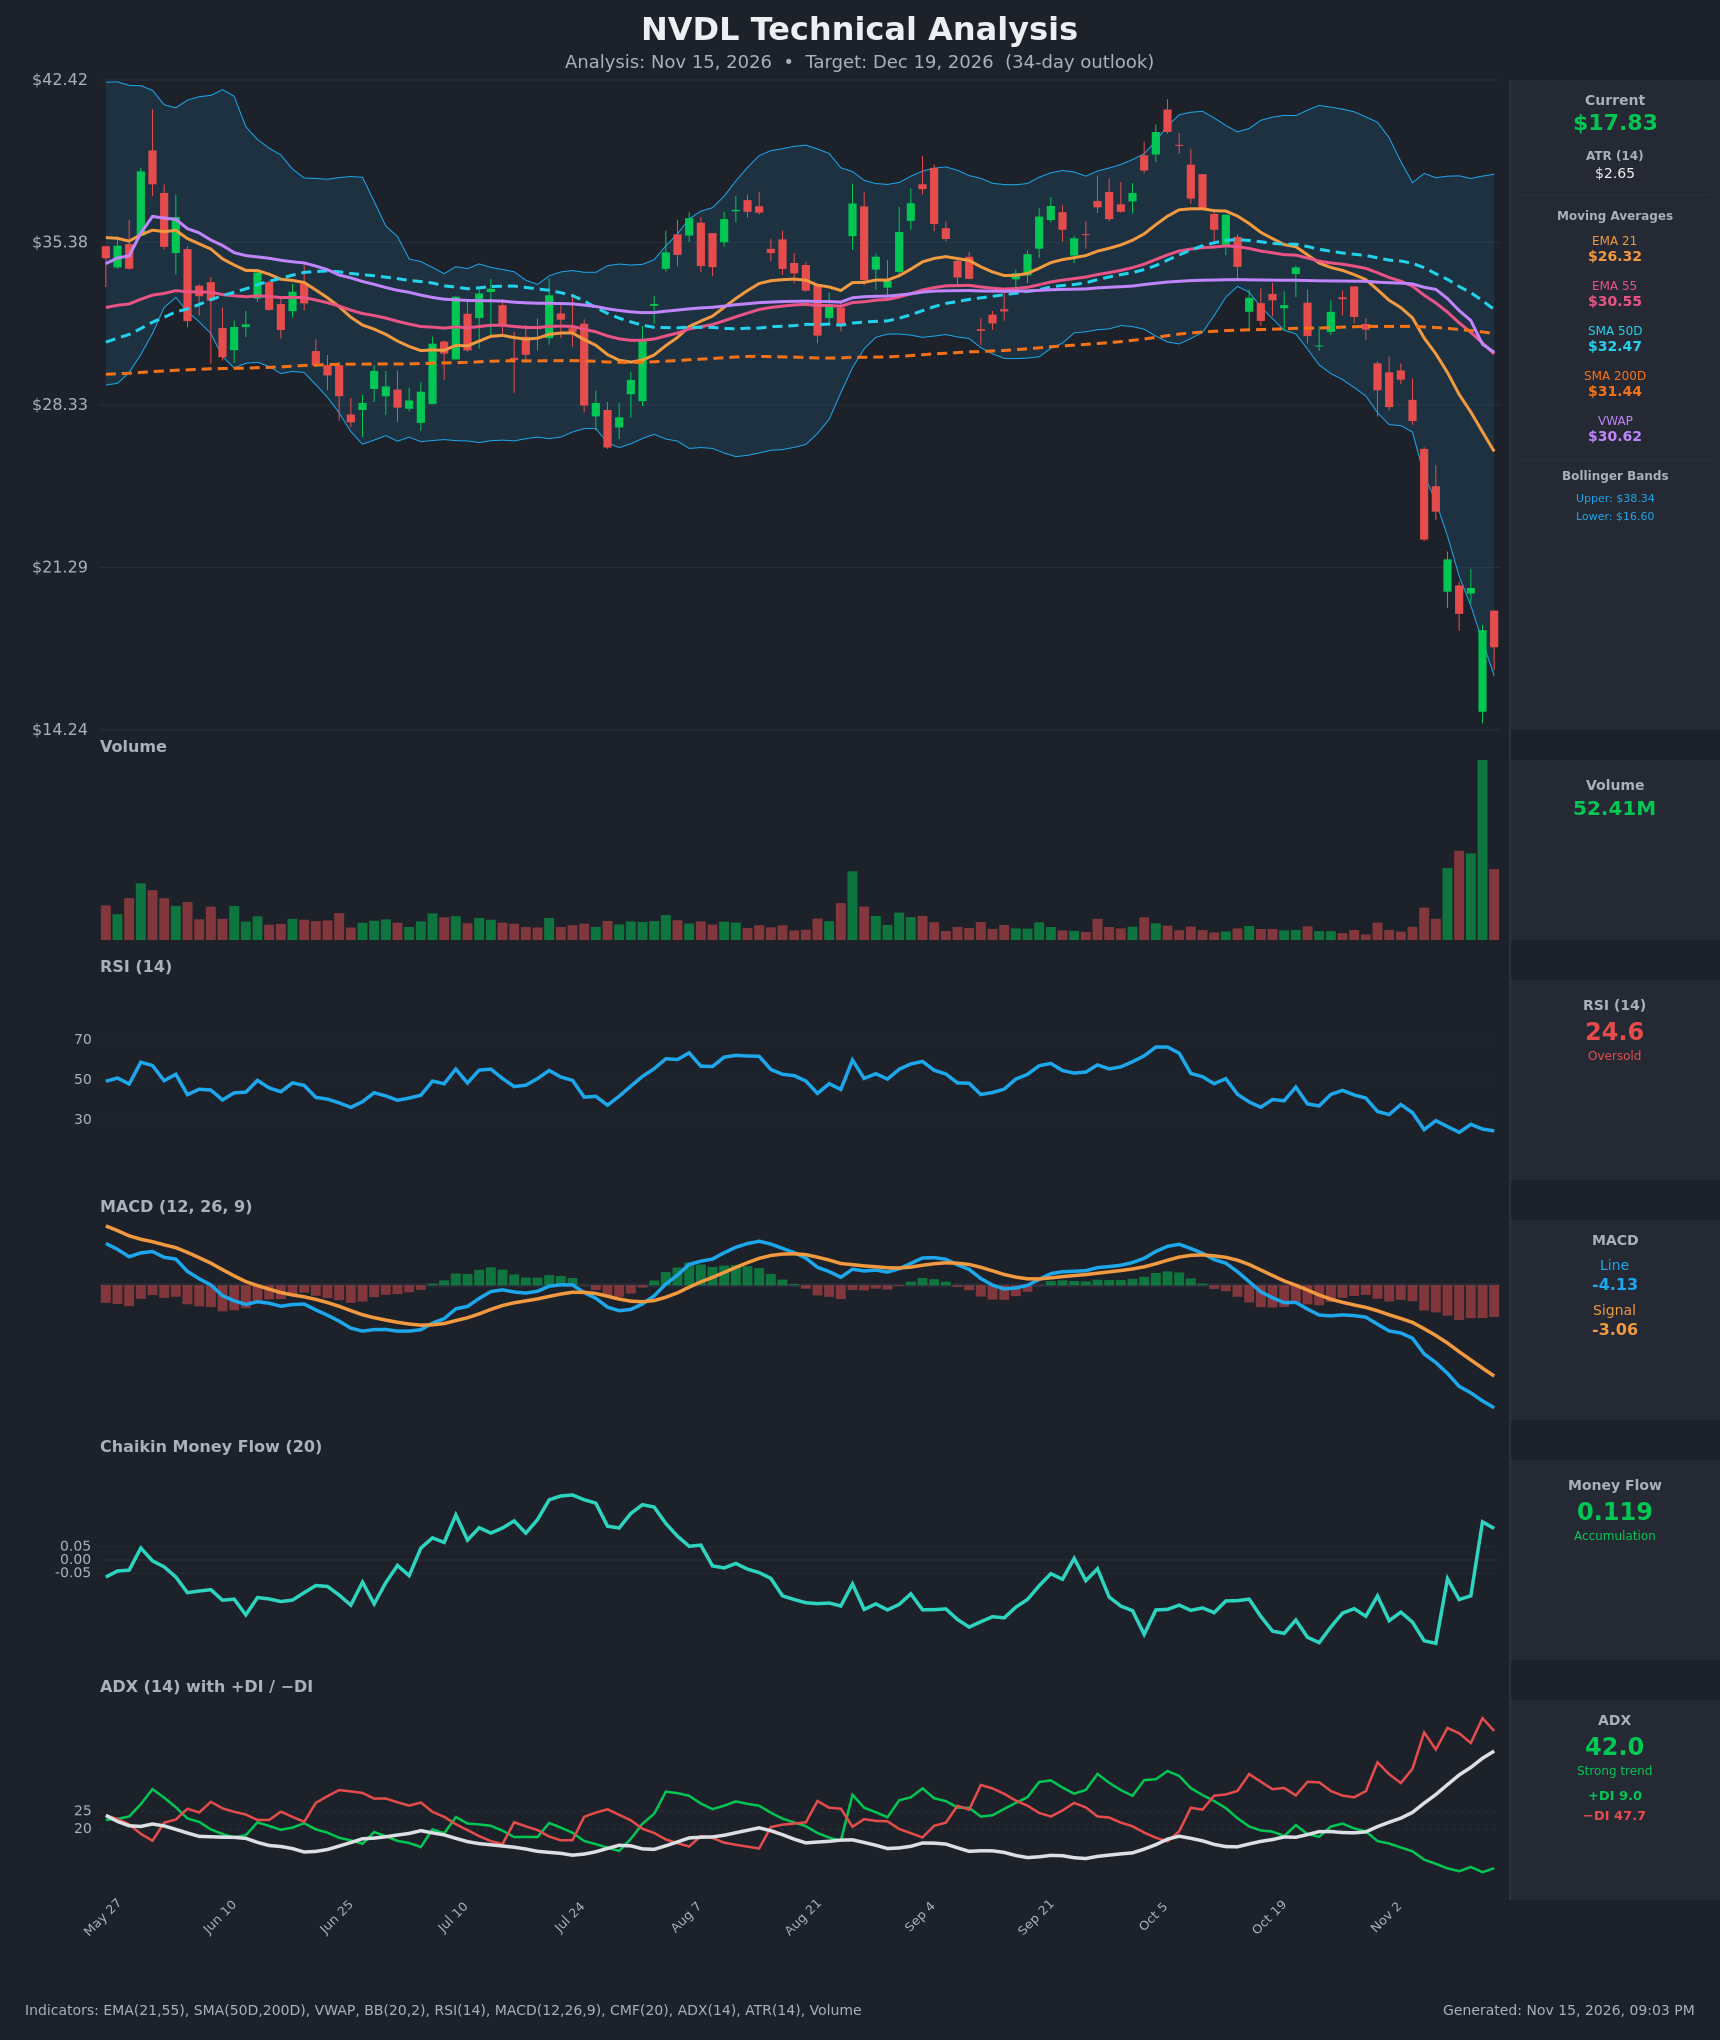
- RSI (14): 24.56, deeply oversold. It has been below 30 on most bars since Nov 5 and is still making lower lows (23.8 on Nov 10, 24.6 now), so momentum is still falling but is near exhaustion. [Bullish] (contrarian)
- 20 EMA: The 21 EMA is $26.32 and price at $17.83 is about 32% below it. The EMA is falling steeply, and the EMA21 has already crossed below the EMA55 ($30.55). The EMA is far overhead resistance. [Bearish]
- MACD: Line -4.13 is below signal -3.06, and the gap is widening (-1.07 now vs. -0.56 on Nov 4). The histogram is increasingly negative and the line is accelerating down with no sign of a turn. [Bearish]
- Bollinger Bands (20): Bands are $16.60 to $38.34 and very wide after the volatility expansion. Price at $17.83 is hugging the lower band, about 6% above it, after riding it for several sessions. This is a stretched condition that often leads to a relief bounce, but bands that expand like this can keep "walking" lower. [Neutral]
- CMF (20): +0.119, up from about -0.30 on Nov 5-6 and positive since Nov 12 (+0.143). Money flow turned positive while price kept falling, which signals buyers absorbing the heavy selling. [Accumulation]
- ADX (14): 42.0 and rising (from 19 two weeks ago). −DI is 47.7 and +DI is only 9.0, so the downtrend is strong and bears are firmly in control. ADX above 40 after a vertical drop often marks a mature, late-stage move. [Strong Trend – Bearish]
- Volume: 52.41M, the largest bar on the chart by a wide margin and many times the normal level. It came with a long lower wick on Nov 12 and a deep intraday low, which looks like capitulation or climactic selling. The red follow-through candle on Nov 13 shows sellers have not fully given up. [Capitulation – possible bottoming]
DIVERGENCES & TRENDS
- CMF vs. price: CMF has flipped from about -0.30 to +0.12 while price made new lows ($18.57 → $17.83). This is a bullish divergence that points to accumulation on the capitulation volume.
- RSI vs. price: RSI is making only marginally lower lows (23.8 → 24.6) against a violent price decline. There is no clean divergence yet, but the downside momentum is flattening.
- MACD and ADX: Both are still trending the wrong way for bulls. MACD is widening and ADX is rising, so the trend has not exhausted.
- Moving averages: The SMA50D ($32.47) is above the SMA200D ($31.44), so there is no death cross yet, but the two are converging and one is likely within weeks. Price is about 43% below the SMA200D, an extreme stretch.
- VWAP: Price is far below VWAP ($30.62), which means sellers have been in control. Any rebound will meet heavy supply near the mid-$20s.
- Crossovers: The MACD bearish cross, the EMA21/55 bearish cross and the −DI dominance are all well established.
CHART PATTERNS
- There is no clean textbook consolidation. The move is a near-vertical breakdown of about 45% in 13 sessions, similar to the downward leg that precedes the "Bullish Double Bottom" or "Bullish Falling Wedge" in the reference. No base has formed yet.
- A potential Bullish Double Bottom would form if price retests the recent capitulation low (about $14.8-$15.5) and holds. Confirmation would come from a close above the interim peak at $20.40-$21.60, with a measured move toward the mid-$20s.
- If price instead fails to hold the lower band, the pattern becomes a bearish continuation. The chart shows no flag or pennant yet, so downside targets would rely on ATR extension.
- The most likely path in the 34-day window is a dead-cat bounce or a base-building range under heavy overhead resistance at $19.30-$21.60.
POTENTIAL SCENARIOS
- Scenario 1: Bullish Capitulation Relief Bounce — Climactic volume, RSI near 24, CMF turning positive and price at the lower Bollinger Band favor a mean-reversion rally, though it stays well below the declining EMA21. Trigger: Daily close above $19.30 (Nov 10 close) with CMF staying above +0.05. Target: $19.20-$21.60, with a stretch toward $22.50 (Nov 5 close). Invalidation: Daily close below $16.00 that holds. (50% probability)
- Scenario 2: Bearish Trend Continuation — ADX is 42 with −DI at 47.7 and a widening MACD, and the Nov 13 red candle shows selling is not exhausted. A leveraged ETF can keep falling as the underlying drops. Trigger: Break below $16.60 (lower BB) and the capitulation low around $15. Target: $13.50-$15.00. Invalidation: Reclaim of $20.40 on solid volume. (40% probability)
- Scenario 3: Neutral Base Building — Price chops between about $16 and $20 as the market digests the capitulation. Trigger: Low-volume tight range, ADX rolling over. Target: $17-$19. Invalidation: Close outside the $16.00 to $20.40 range. (10% probability)
PRICE TARGETS
- Target Price: $19.20 (34-day, about +7.7% from $17.83)
- Expected Range: $16.40 to $19.60 (width $3.20, about 18% of current price, in line with the 30-60 day guidance)
- Key Levels: Support at $16.60 (lower Bollinger Band), Resistance at $19.30 (Nov 10 close; next resistance $20.40)
OVERALL BIAS
OVERALL BIAS: BULLISH - Capitulation-level volume, RSI near 24, price at the lower Bollinger Band and CMF flipping positive favor a relief bounce toward the high $19s. Conviction is modest because ADX is 42 with −DI dominant, and MACD and the moving averages remain firmly bearish, so a bounce will face heavy overhead resistance.
This is educational analysis and not financial advice.