SHOP 60-day bearish forecast — Nov 17, 2026
- Bias: Bearish
- Timeframe: 60 days (made Nov 17, 2026, target date Jan 15, 2027)
- Price at analysis: $148.42
- Price target: $140.00
- Expected range: $128.00 – $152.00
- Result: Pending — graded after the close on Jan 15, 2027
Get a free AI analysis of SHOP today
Analysis
TECHNICAL INDICATORS
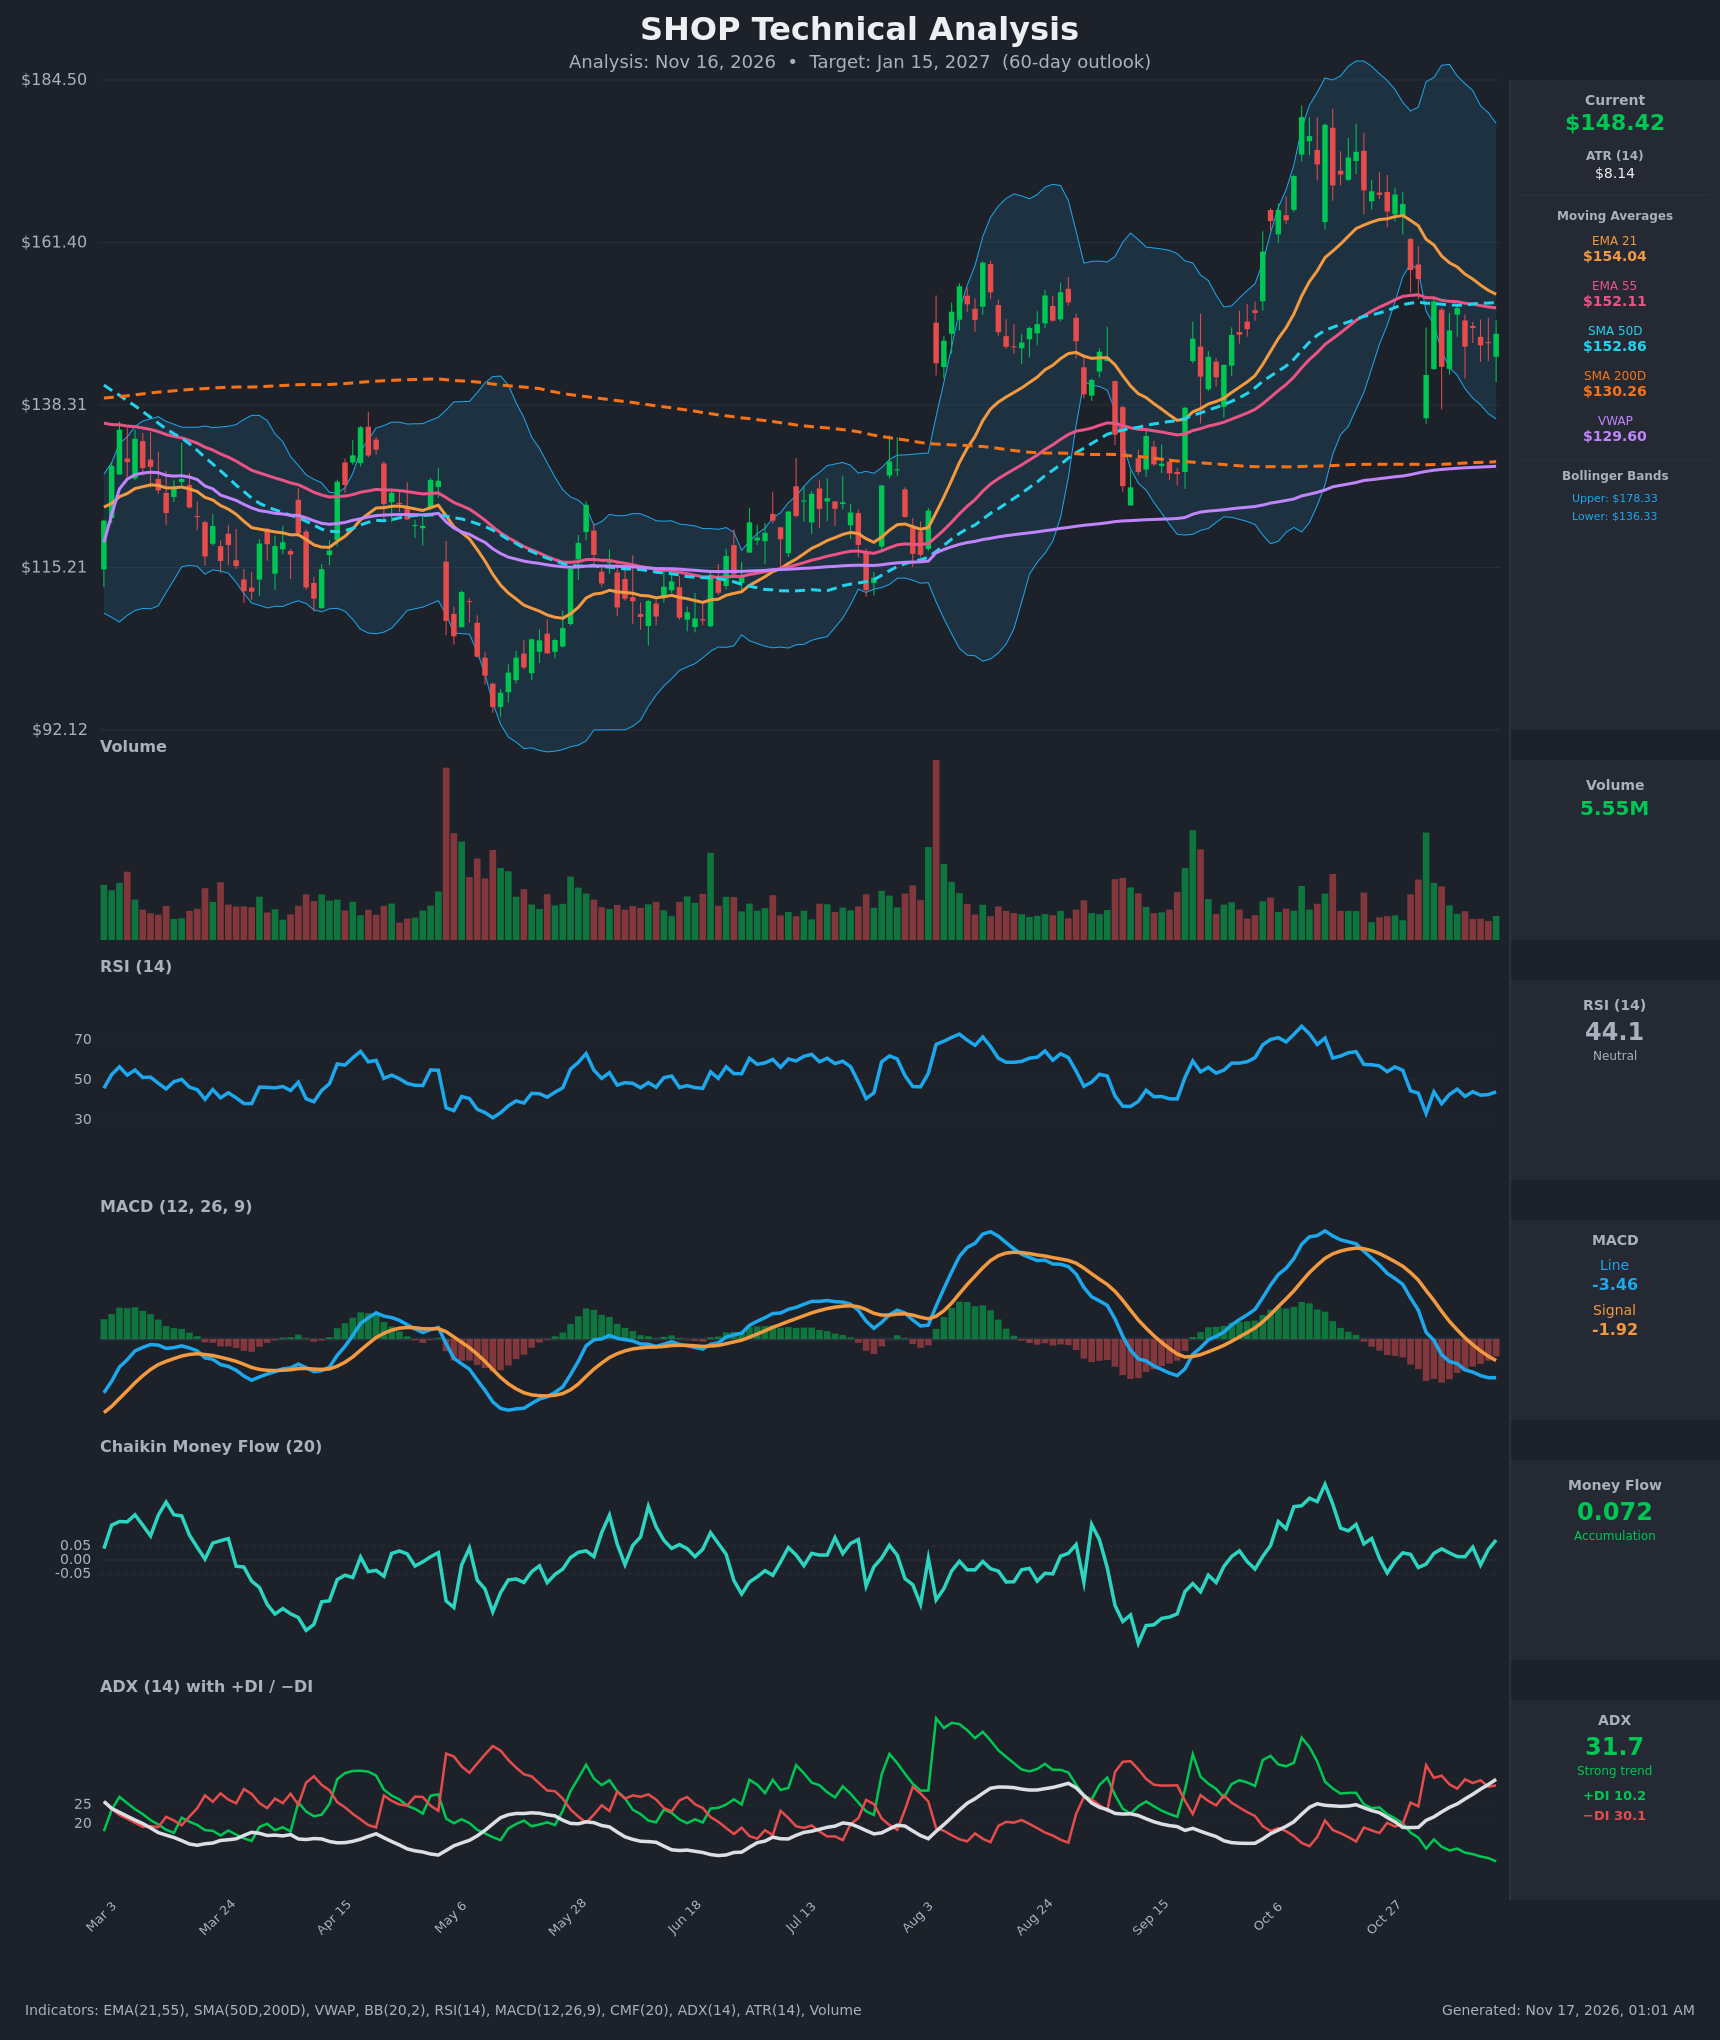
- RSI (14): 44.06, below the 50 midline but well above oversold (30). It bottomed at 33.3 on Nov 3 and has since oscillated in a 38-45 band, so momentum is subdued with no bullish recovery yet. [Bearish]
- 20 EMA: The supplied value is EMA 21 at $154.04. Price at $148.42 is below it, and the EMA has been falling from about $165 in late October, so it acts as overhead resistance. EMA21 is converging on EMA55 ($152.11). A bearish EMA21/EMA55 cross is close, about $1.93 apart and narrowing by roughly $0.5-0.8 per day. [Bearish]
- MACD: Line -3.46 is below signal -1.92, and both are below zero. The line crossed below signal in late October and below zero on Nov 4. The histogram (about -1.54) has narrowed from -2.2 on Nov 9 and -1.9 on Nov 13, which hints at slowing downside momentum but no bullish crossover yet. [Bearish]
- Bollinger Bands (20): Upper $178.33, lower $136.33, so the midline is about $157.33. Price sits in the lower half, below the midline, which is acting as resistance. The bands are still wide, about 28% of price, after the October spike and drop. The Nov 3 flush touched the lower band area near $136-143 and was bought. [Bearish]
- CMF (20): +0.072, above the +0.05 accumulation threshold but only marginally, and it has flipped between -0.03 and +0.07 over the past two weeks. This is mild dip-buying and the only constructive indicator, but it is not a sustained signal. [Accumulation]
- ADX (14): 31.7 and rising from 19 in late October, so a strong trend is established. −DI (30.1) is far above +DI (10.2), and the −DI/+DI spread is large. Sellers firmly control the trend. [Strong Trend – Bearish]
- Volume: 5.55M, below the spikes seen on the large moves (e.g., early Aug and early Nov selling). The recent chop between $143 and $153 is on modest volume, which suggests a pause or digestion rather than aggressive accumulation. [Neutral / Lack of Bullish Conviction]
DIVERGENCES & TRENDS
- No clear bullish RSI divergence. RSI made a higher low on Nov 4 (44.1) and again on Nov 16 (44.1), while price made a lower low on Nov 3 ($142.57) and a modest higher low since. This is only a mild stabilization, not a confirmed divergence.
- The MACD histogram is shrinking while the line is still falling. This is an early sign of selling exhaustion, but it needs a line/signal cross to matter.
- CMF has been turning up (0.072) while price is flat to lower. This is a minor positive divergence, though too small to override the trend signals.
- The trend structure is bearish. Price has dropped from the ~$178 October peak and is below EMA21, EMA55 and SMA50 (all clustered at $152-154, which forms a resistance zone). SMA50 ($152.86) is still above SMA200 ($130.26), so there is no death cross, but a bearish EMA21/EMA55 cross is imminent.
- Price remains above SMA200 ($130.26) and VWAP ($129.60), so the long-term trend is still intact. Those two levels are the main downside magnets.
- ADX is rising with −DI dominant, which confirms the pullback is a directional move rather than random noise.
CHART PATTERNS
- Bearish Flag / Pennant (continuation): After the sharp drop from ~$178 to the low $140s, price has been consolidating in a $142-$153 range with lower highs. This resembles the bearish flag/pennant in the reference diagram. A breakdown below ~$142.50 would project a measured move toward about $130, which coincides with SMA200.
- Rectangle-style consolidation: The $142.5-$153 range is bounded by the Nov 3 low and the cluster of moving averages. Resistance is strong, and a break either way would set the direction.
- Possible bearish double top (loosely): The peaks near $170-178 in October after the August rally resemble a topping structure, with the break of the EMA21 supporting a reversal.
- The bullish counter-pattern (a base/triple bottom) is not confirmed. A close above $154 would be needed to challenge the bearish read.
POTENTIAL SCENARIOS
- Scenario 1: Bearish Flag Breakdown to SMA200 — Price fails at the $152-154 moving-average cluster, the EMA21/EMA55 bearish cross completes, and support at $142.50 breaks. Trigger: daily close below $142.50 on rising volume. Target: $136 first, then $130 (SMA200/VWAP zone). Invalidation: daily close above $154.50 (EMA21 and SMA50). (50% probability)
- Scenario 2: Bullish Reclaim of the Moving Averages — Dip buying (CMF positive) and the narrowing MACD histogram lead to a bullish MACD cross and a reclaim of the $152-154 cluster. Trigger: close above $154.50 with volume above ~7M. Target: $165, then the Bollinger midline/upper area near $170. Invalidation: close back below $146. (28% probability)
- Scenario 3: Neutral Range Persistence — Price continues oscillating between $140 and $154 as the moving averages converge and the ADX cools. Trigger: no close outside $142.50-$154. Target: $145-$150. Invalidation: a decisive close outside the range. (22% probability)
PRICE TARGETS
- Target Price: $140.00 (60 days, Jan 15, 2027)
- Expected Range: $128.00 to $152.00 (width $24 = ~16.2% of current price, in line with the 12-18% guidance for 30-60 days)
- Key Levels: Support at $136.33 (lower Bollinger Band, with SMA200 at $130.26 below it), Resistance at $152.86 (SMA50, with EMA21 at $154.04 just above)
OVERALL BIAS
OVERALL BIAS: BEARISH - Price is below EMA21, EMA55 and SMA50, and ADX at 31.7 with −DI (30.1) far above +DI (10.2) shows sellers dominating. MACD is negative, the consolidation looks like a bearish flag, and the EMA21/EMA55 bearish cross is imminent. Mild CMF accumulation and the SMA200 below limit the downside to roughly $130-$136.
This is educational analysis and not financial advice.