COHR 44-day bearish forecast — Nov 17, 2026
- Bias: Bearish
- Timeframe: 44 days (made Nov 17, 2026, target date Dec 31, 2026)
- Price at analysis: $215.27
- Price target: $203.00
- Expected range: $95.00 – $400.00
- Result: Pending — graded after the close on Dec 31, 2026
Get a free AI analysis of COHR today
Analysis
TECHNICAL INDICATORS
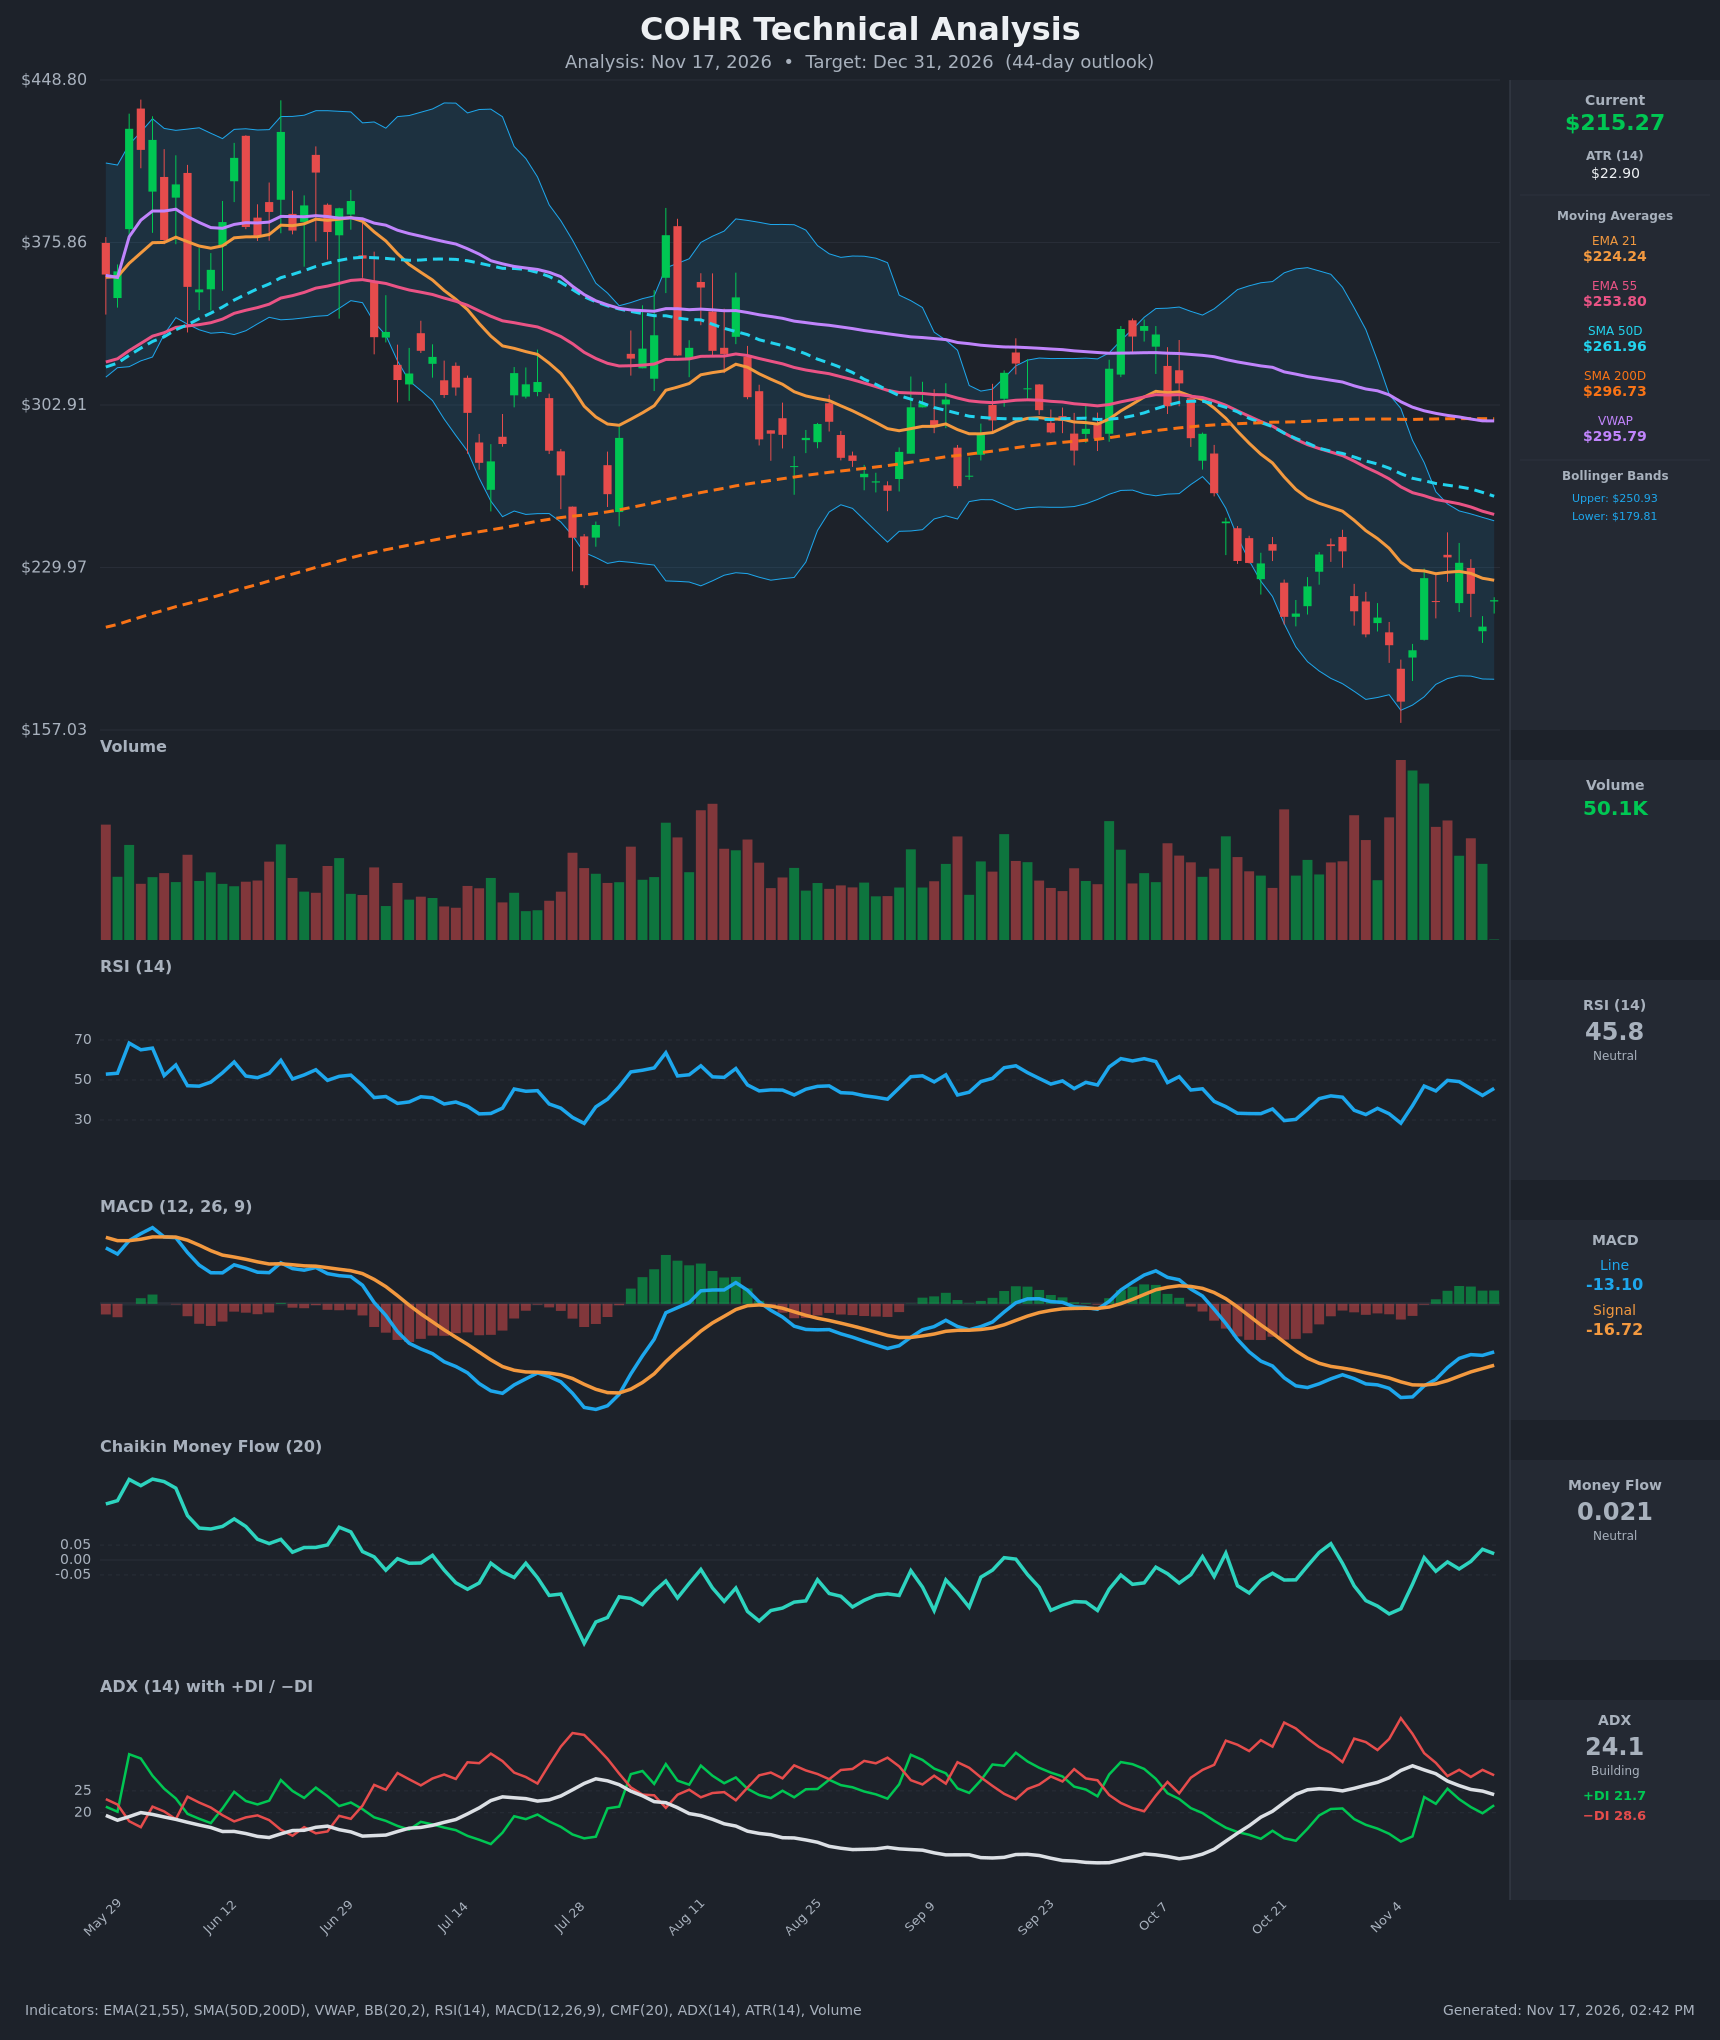
- RSI (14): 45.80, slightly below the 50 midline. It bounced from 28.4 on Nov 5 and peaked near 49.8 on Nov 11, but has not reclaimed 50. Momentum is recovering and still capped. [Neutral]
- Moving Averages: Price ($215.27) is below every average: EMA 21 ($224.24), EMA 55 ($253.80), SMA 50D ($261.96), SMA 200D ($296.73) and VWAP ($295.79). All act as overhead resistance. EMA 21 is below EMA 55 and SMA 50D is below SMA 200D, so the death cross is already in place. Price closed above EMA 21 on Nov 9–12 but has slipped back under it. [Bearish]
- MACD: The line (-13.10) crossed above the signal (-16.72) around Nov 9, and the histogram is positive and widening. Both lines remain well below zero, so this is a bounce within a larger downtrend rather than a confirmed trend change. [Neutral]
- Bollinger Bands (20): Upper is $250.93 and lower is $179.81, putting the midline near $215, right at price. The bands are wide and rolling over, which reflects high volatility. Price has recovered from the lower-band tag at $169.76 but has not moved into the upper half. [Neutral]
- CMF (20): 0.021, inside the ±0.05 neutral zone. It has improved from -0.18 on Nov 4 but shows no real accumulation. [Neutral]
- ADX (14): 24.1, near the 25 threshold and now fading from a 30.7 peak. −DI (28.6) is above +DI (21.7), so bears are still in control, though the gap has narrowed from about 27 points to about 7. [Moderate Trend – Bearish]
- Volume: 50.1K. Volume spiked sharply on the late-October/early-November selloff, which looks like capitulation, and has since faded to moderate levels on the bounce. The recovery has not drawn strong buying volume. [Neutral to slightly bearish]
DIVERGENCES & TRENDS
- Price made its low on Nov 5 ($169.76), and MACD and RSI have since turned up. This is a short-term improvement in momentum, not a clean bullish divergence.
- Since Nov 11 the recovery has made lower highs ($234.51 → $232.08 → $218.15) and a lower close ($203.43 on Nov 16), so the bounce is losing steam.
- MACD crossed bullish while still deeply below zero. These crossovers in a downtrend often fail at the zero line.
- The bearish DI structure is easing, with −DI falling from 41.7 to 28.6. ADX is falling, which suggests the selling pressure is exhausting but a bullish trend is not yet starting.
- Long-term structure is bearish: death cross, all averages sloping down, and price far below SMA 200D and VWAP.
CHART PATTERNS
- Bear flag / rising channel (continuation, bearish): The bounce from $169.76 to about $234 is a corrective rally after a sharp drop. The lower highs suggest it may roll over. A break below about $195–$200 would project toward the prior low near $170, and below it toward the $157 chart low.
- Possible double bottom (reversal, bullish): The Nov 5 low and a retest would form a double bottom. It is unconfirmed, because that needs a close above the roughly $234 swing high, and EMA 21 and EMA 55 sit above price as additional resistance.
- Overall, the larger structure is a series of lower highs and lower lows since the May highs near $440. The bearish continuation pattern has a slight edge over the reversal pattern.
POTENTIAL SCENARIOS
- Scenario 1: Bearish Rollover and Lower Low — The bounce fades at EMA 21 / the $225–$235 zone and the downtrend resumes, with −DI re-expanding. Trigger: close below $195–$200 on rising volume. Target: $170, then $150–$160 on extension. Invalidation: daily close above $235. (45% probability)
- Scenario 2: Bullish Capitulation Reversal — The Nov 5 capitulation low holds, and the MACD cross, improving CMF and a double-bottom setup drive a mean-reversion rally toward the EMA 55 / upper Bollinger Band. Trigger: close above $235 with volume. Target: $250–$265 (EMA 55 / SMA 50D area). Invalidation: close below $170. (35% probability)
- Scenario 3: Neutral Choppy Consolidation — Price ranges between the $170–$180 support zone and the $225–$235 resistance as volatility compresses. Trigger: failure to break either side. Target: $190–$230. Invalidation: close outside $165–$240. (20% probability)
PRICE TARGETS
- Target Price: $203.00 (44-day outlook, ending around Dec 31, 2026)
- Expected Range: $95.00 to $400.00 (about 1.85x the typical move of $164.79, shifted slightly lower toward the bearish bias)
- Key Levels: Support at $169.76, Resistance at $234.51
OVERALL BIAS
OVERALL BIAS: BEARISH - Price is below all key moving averages with a death cross in place, −DI is above +DI, and the bounce is making lower highs below EMA 21. The improving MACD and RSI argue for a possible bottom, but they have not yet broken the downtrend, so conviction is modest.
This is educational analysis and not financial advice.