APLD 31-day bearish forecast — Nov 18, 2026
- Bias: Bearish
- Timeframe: 31 days (made Nov 18, 2026, target date Dec 18, 2026)
- Price at analysis: $14.22
- Price target: $12.40
- Expected range: $5.50 – $25.50
- Result: Pending — graded after the close on Dec 18, 2026
Get a free AI analysis of APLD today
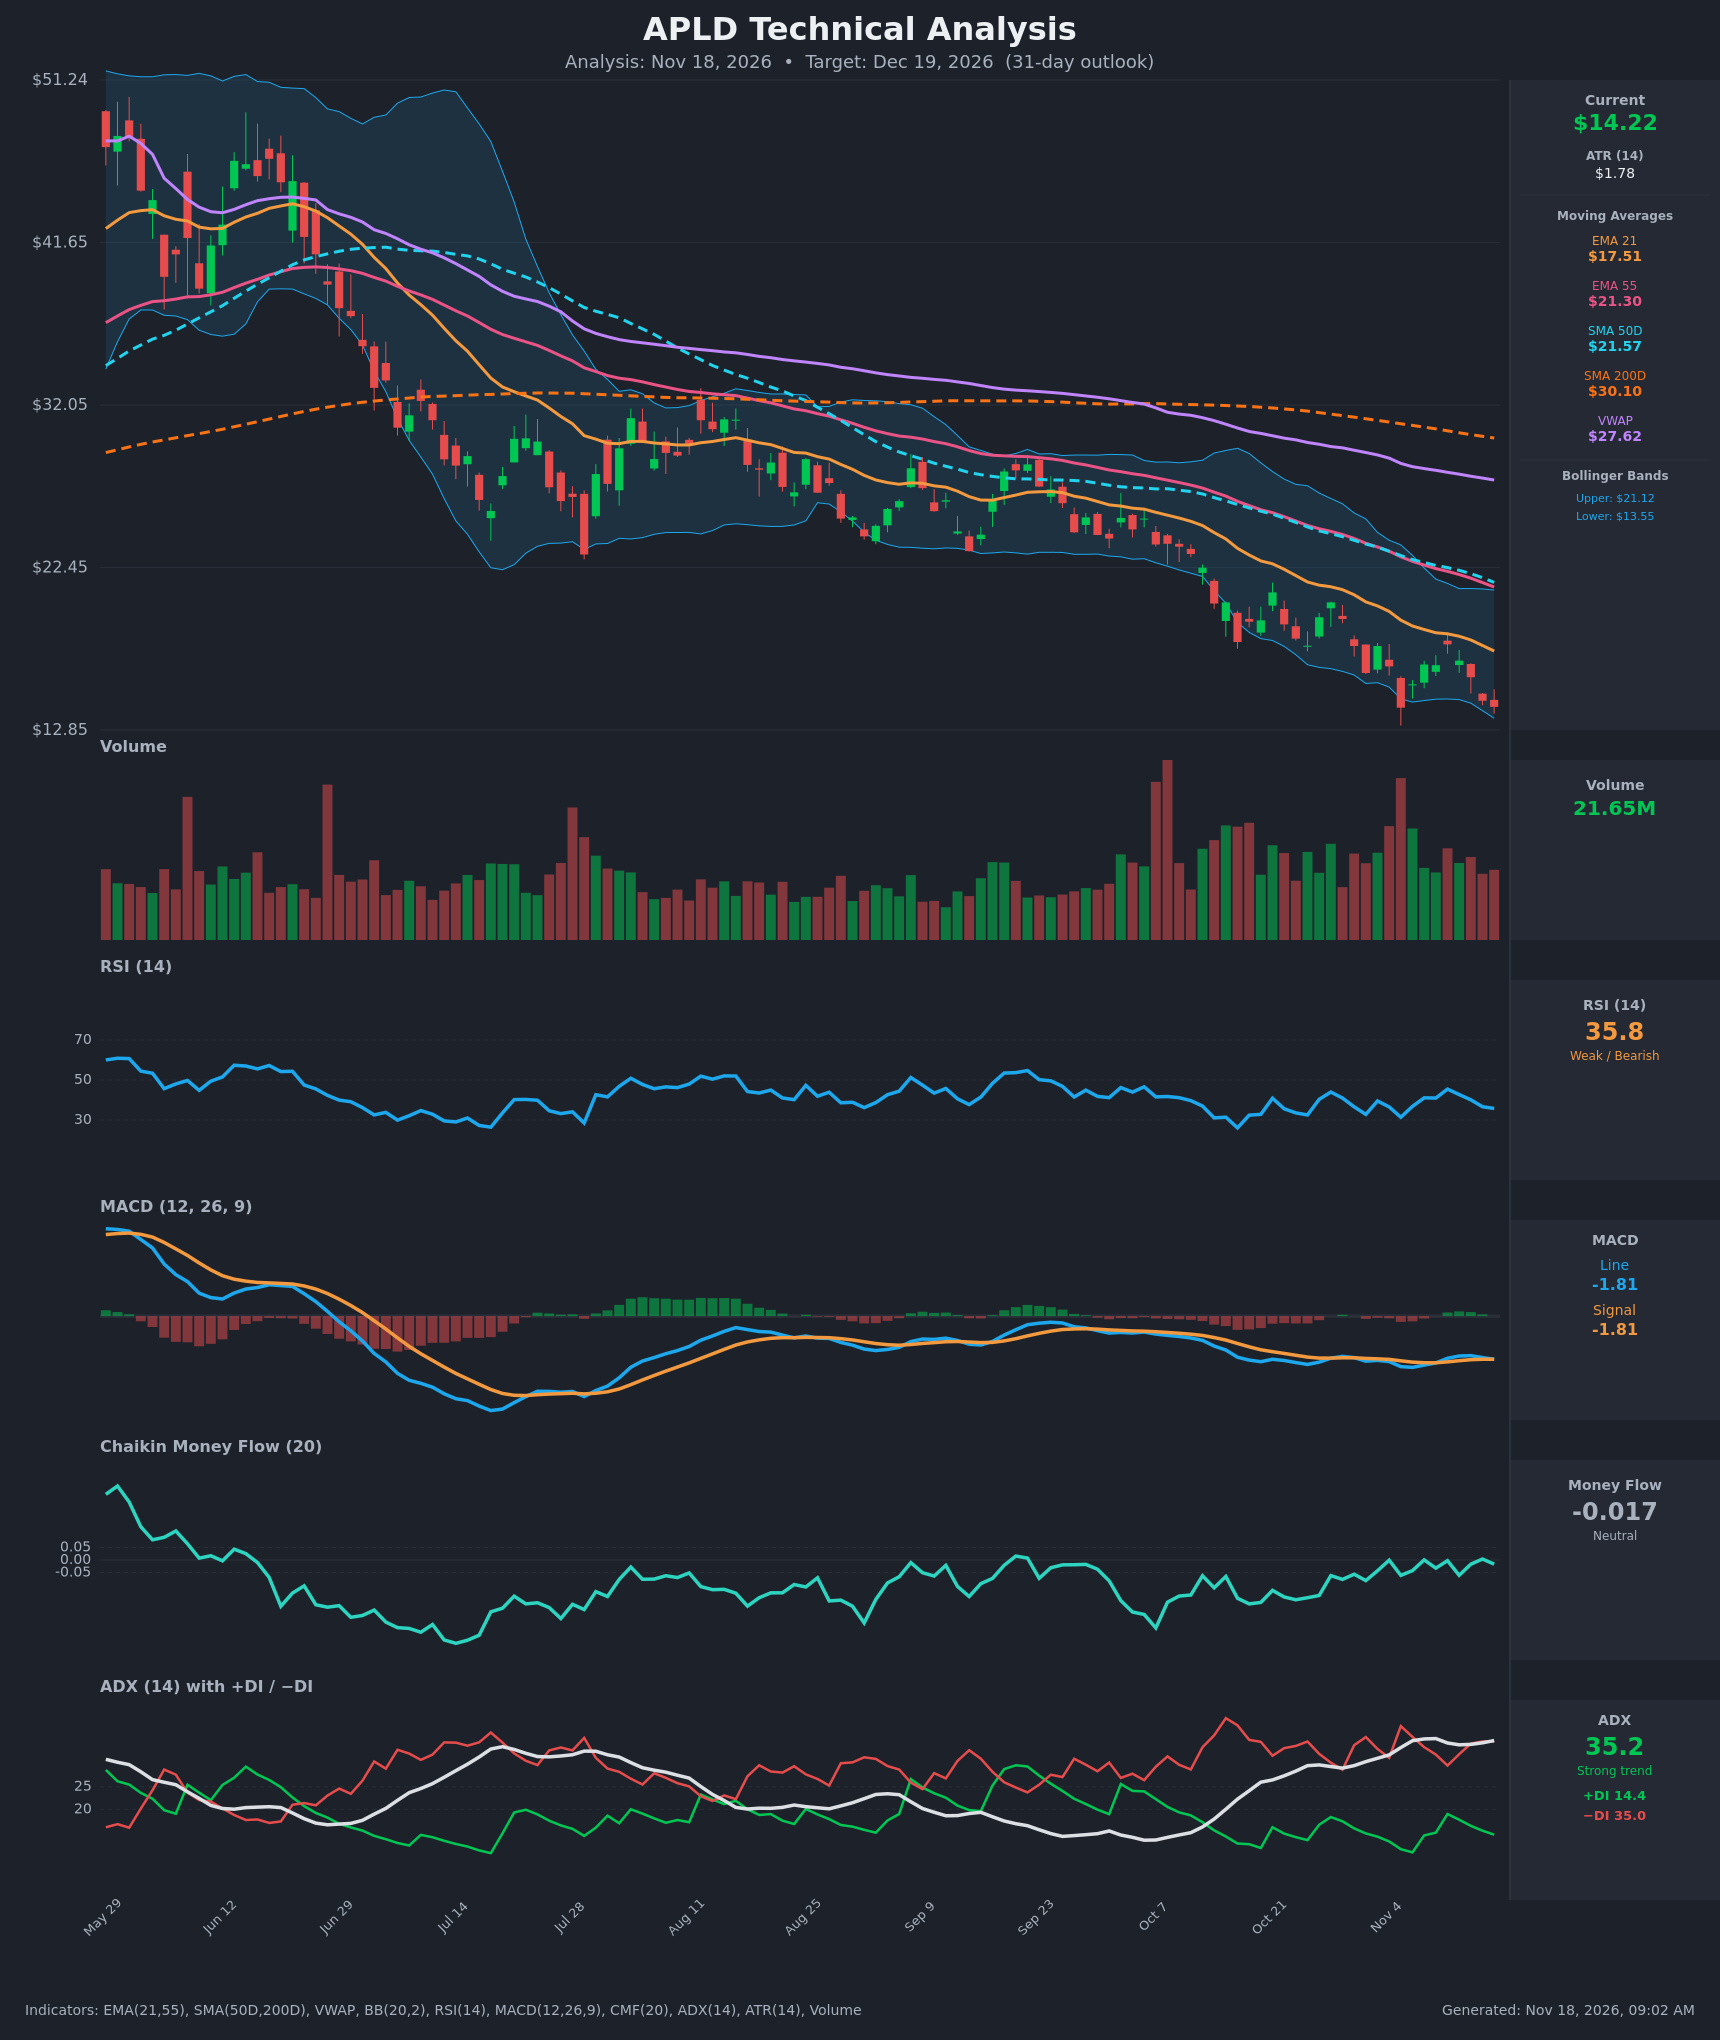
Analysis
TECHNICAL INDICATORS
- RSI (14): 35.77, near but not in oversold (<30). It has stayed in a 30-45 band for months, with brief dips toward 31-33 on Nov 2 and Nov 5. Momentum is flat to slightly down after rolling over from 45.4 on Nov 11. Selling is persistent, not exhausted. [Bearish]
- Moving Averages: Price ($14.22) is below every average, so each acts as overhead resistance: EMA 21 ($17.51), EMA 55 ($21.30), SMA 50D ($21.57), VWAP ($27.62) and SMA 200D ($30.10). EMA 21 is below EMA 55 and SMA 50D is far below SMA 200D, so the death cross is long established. The gap between price and EMA 21 is widening (about 19% below), and every average is still sloping down. [Bearish]
- MACD: Line -1.8055 against signal -1.8052, with the histogram essentially zero. The line has just dipped back under the signal after a brief cross higher on Nov 11-12. Both sit well below zero and are flat, so momentum is not accelerating down but offers no bullish confirmation either. [Bearish]
- Bollinger Bands (20): Upper $21.12, lower $13.55. Price ($14.22) is in the lower part of the bands, about 0.1 of band width above the lower band. The bands are wide, and price has been walking the lower band since mid-October. Walking the band is a trend-continuation sign rather than a reversal signal. A close below $13.55 would re-expand the bands to the downside. [Bearish]
- CMF (20): -0.017, between ±0.05, so neutral. It has been hovering around zero for weeks, having recovered from deeper distribution in June-July. Sellers are not aggressively distributing, but there is no accumulation to support a rebound either. [Neutral]
- ADX (14): 35.2 and rising, a strong trend. −DI (35.0) is far above +DI (14.4), so bears are firmly in control. ADX has risen from below 20 in early September to 35 as the downtrend accelerated. [Strong Trend - Bearish]
- Volume: 21.65M, roughly average relative to the recent bars. The heaviest recent volume came on down days (the spike around the Nov 5 low) and was not followed by a durable bounce. There is no capitulation volume spike confirming a bottom. [Neutral to Bearish: no exhaustion signal]
DIVERGENCES & TRENDS
- RSI vs price: Price has made new lows in November (about $14 and below), but RSI (about 31-36) is above its July and October lows (about 27-29). This mild bullish divergence hints at slowing downside momentum. It is not a trigger without a MACD cross or a volume surge.
- MACD: It is flat just under its signal line near -1.8. There is no bullish divergence, since MACD has failed to rise meaningfully despite the RSI lift, and the histogram is flat.
- Trend structure: The lower-highs and lower-lows sequence from $50 in May to $14 in November is intact. Price has lost every EMA and SMA, and each recent bounce failed at or below EMA 21 (the Nov 11 bounce stalled at $17.91, just above the falling EMA 21 at $18.53).
- Crossovers/breaks:
- ADX/DI: −DI has stayed above +DI. A brief +DI/−DI approach on Nov 11 (19.0 vs 29.7) failed.
- Price broke below the Oct-Nov range lows and is near the lower Bollinger Band.
- The EMA 21/EMA 55 gap is widening, with no sign of convergence.
CHART PATTERNS
- Dominant structure: A long-running descending channel / falling-wedge-like decline from the May high. It is a continuation of a bearish trend, not a confirmed reversal. Price has descended along the lower Bollinger Band since October.
- Bullish Falling Wedge (reference): The narrowing, decelerating lows could eventually resolve into a falling wedge, a bullish reversal pattern. It would need a breakout above the upper trendline, roughly the $17.5 EMA 21 area, on rising volume, and that has not happened. A breakout target would be the start of the wedge (about $21-22, the EMA 55 and SMA 50D cluster).
- Bearish alternative: The recent small bounces ($14.17 to $17.91 to $14.22) resemble a bearish flag/consolidation near the lows. A break below $13.00-$13.55 would project roughly $9-$10 (the measured move of the Nov 3-11 bounce range applied downward).
- Because ADX is 35 with −DI dominant, the trend-continuation reading carries more weight than the reversal reading.
POTENTIAL SCENARIOS
- Scenario 1: Bearish Trend Continuation — Price keeps trending down along the lower Bollinger Band as every MA continues to fall and ADX stays above 30. Sellers defend EMA 21 on any bounce. Trigger: daily close below $13.55 (lower band) and then below $13.00 (the recent swing low area). Target: $9.00-$10.50. Invalidation: daily close above $17.50 (EMA 21) with expanding volume. (50% probability)
- Scenario 2: Bullish Oversold Relief Bounce — The RSI divergence and proximity to the lower band trigger a mean-reversion bounce toward the falling EMA 21 and mid-band. Trigger: a hold above $13.00 and MACD line crossing back above signal with a close above $15.50. Target: $17.50-$19.00 (EMA 21 and mid-band area), which would likely meet strong resistance there. Invalidation: close below $13.00. (35% probability)
- Scenario 3: Neutral Basing Chop — Price consolidates in a $12.50-$17.00 range as selling pressure exhausts, with CMF near zero and MACD flat. Trigger: ADX rolling over below 30 and low-volume sideways candles. Target: $13.00-$16.50. Invalidation: close beyond either range edge. (15% probability)
PRICE TARGETS
Typical move for 31 days is about $10.71 (75.3%), so the expected range is about 2x that wide. The band is shifted down to reflect the bearish bias.
- Target Price: $12.40 (31 days from now)
- Expected Range: $5.50 to $25.50 (width about $20.00, roughly 1.9x the typical move)
- Key Levels: Support at $13.00, Resistance at $17.51
OVERALL BIAS
OVERALL BIAS: BEARISH - Price is below every moving average with a long-standing death cross, ADX at 35 with −DI (35.0) far above +DI (14.4), and a MACD stuck below zero. The mild RSI divergence and neutral CMF limit conviction and leave room for a relief bounce toward $17.50, but the trend favors lower prices.
This is educational analysis and not financial advice.