MRVL 44-day bullish forecast — Nov 4, 2026
- Bias: Bullish
- Timeframe: 44 days (made Nov 4, 2026, target date Dec 18, 2026)
- Price at analysis: $162.70
- Price target: $169.00
- Expected range: $148.00 – $177.00
- Result: Pending — graded after the close on Dec 18, 2026
Get a free AI analysis of MRVL today
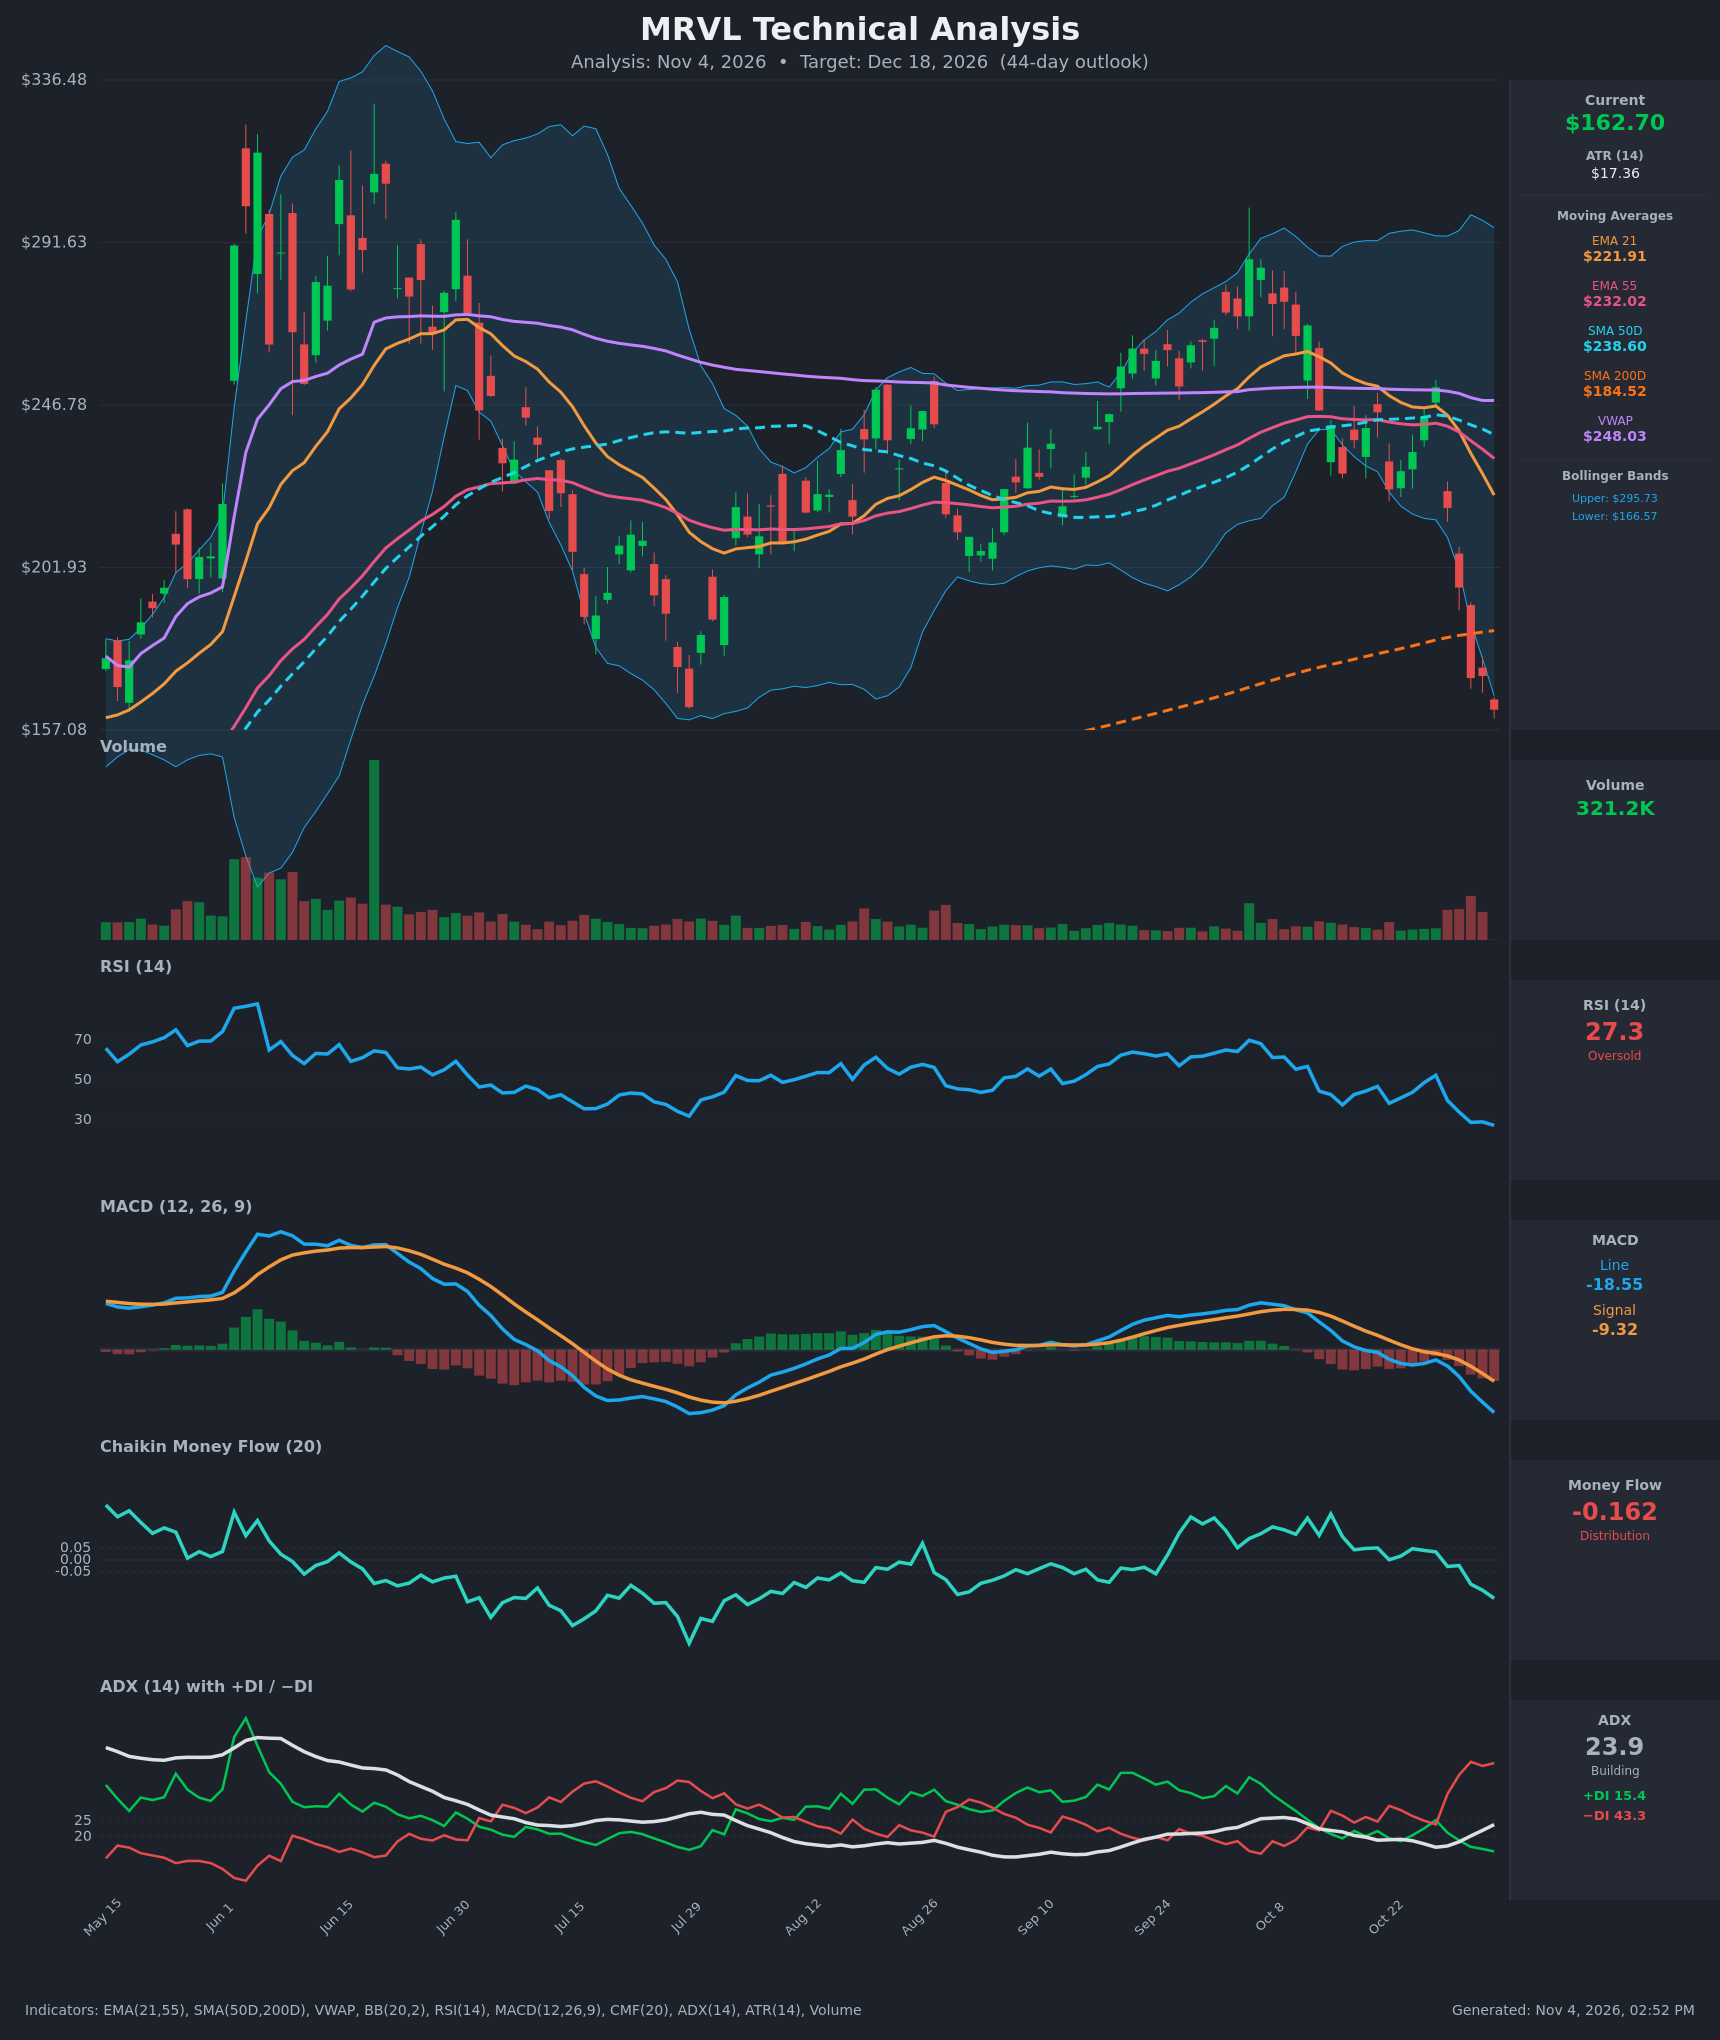
Analysis
TECHNICAL INDICATORS
- RSI (14): 27.29, oversold and down from 52.4 on Oct 28. Momentum is still falling, but the reading is at a level where oversold bounces have formed before (the Jul low near 30). [Neutral, leaning Bullish for a bounce]
- 20 EMA (EMA 21 = $221.91): Price at $162.70 is about 27% below it, and the average is falling steeply. EMA21 crossed below EMA55 ($232.02) on Oct 30, so it is acting as heavy overhead resistance. [Bearish]
- MACD: Line -18.55 is below signal -9.32 and widening, with a deepening negative histogram. The bearish crossover came around Oct 20, and the line has been below zero since. [Bearish]
- Bollinger Bands (20): Price is at or just below the lower band ($166.57), and the bands are expanding (upper $295.73). A close outside the lower band shows a strong downside impulse. It also marks short-term stretch, so a snap-back toward the mid-band is possible, but in expanding bands price can "walk the band" lower. [Bearish with oversold-bounce risk]
- CMF (20): -0.162, well below -0.05 and falling for several weeks. This is clear distribution and sustained selling pressure. [Distribution]
- ADX (14): 23.9 and rising from 16.7. −DI at 43.3 is far above +DI at 15.4. The trend is not yet above 25, but it is gaining strength, and the bears are in full control. [Building Trend, Bearish]
- Volume: 321.2K. Volume has increased on the last red candles of the drop, and no capitulation spike has appeared yet. Heavier volume on declines confirms the selling, but there is no exhaustion signal. [Bearish confirmation, no capitulation yet]
DIVERGENCES & TRENDS
- There is no bullish RSI or MACD divergence yet. RSI (27.3) and MACD (-18.5) are making new lows in step with price.
- The moving-average structure has flipped bearish:
- Price is below EMA21, EMA55, SMA50D, VWAP ($248.03) and, importantly, SMA200D ($184.52).
- EMA21 crossed below EMA55 on Oct 30.
- SMA50D ($238.60) is still above SMA200D, so there is no death cross yet. It is flattening and rolling over.
- Price fell about 35% in five sessions, from $251.65 on Oct 28 to $162.70, and broke below SMA200D.
- The last two days show a slight pause (close $171.97 then $162.70), and the RSI slope is flattening. These are early signs of selling exhaustion but not confirmation.
- CMF and ADX/DI both confirm the downtrend, so the main risk to the bears is a mean-reversion bounce, not a trend change.
CHART PATTERNS
- Bearish Double Top (loose): The June peak (~$330) and the October peak (~$290) form a lower-high double top. The neckline is the July low near $157-$160, which price is now testing. A decisive close below it would validate the pattern and open a measured move far below, though that target is unrealistic within 44 days.
- Failed Ascending/Rising Channel: The Aug-Oct climb broke down sharply. This is a bearish reversal behaviour similar to the Bearish Rising Wedge breakdown.
- Breakdown through SMA200D: There is no textbook bullish reversal pattern yet, such as a double bottom or inverted head and shoulders. A bounce would need to reclaim $184.52 to be taken seriously.
POTENTIAL SCENARIOS
- Scenario 1: Bullish Oversold Relief Bounce — RSI below 30, a close outside the lower Bollinger Band and a 27% stretch below EMA21 invite a mean-reversion rally, as seen after the July low. Price holds the $157 neckline and retraces toward the lower-band area and then the SMA200D zone. Trigger: daily close above $171-$172 (the recent bar highs) with RSI back above 30. Target: $175-$185 (SMA200D at $184.52 is the cap). Invalidation: close below $157. (45% probability)
- Scenario 2: Bearish Trend Continuation — −DI dominance, negative CMF and a widening MACD gap suggest the double-top neckline gives way and ADX pushes above 25. Trigger: daily close below $157 on rising volume. Target: $135-$145 (about 1x-1.5x ATR multiples below, extended on further downside). Invalidation: reclaim of $184.52. (40% probability)
- Scenario 3: Neutral Base Building — Price chops between $150 and $180 as selling exhausts and the falling EMAs catch down. Trigger: ADX stalls below 25 with RSI oscillating at 30-45. Target: $160-$172. Invalidation: close outside $148-$185. (15% probability)
PRICE TARGETS
- Target Price: $169.00 (44-day horizon)
- Expected Range: $148.00 to $177.00 (width $29 ≈ 17.8% of the current price, consistent with the 30-60 day guidance of 12-18%)
- Key Levels: Support at $157.00 (July low and double-top neckline), Resistance at $184.52 (SMA200D, with the falling EMA21 at ~$222 well above it)
OVERALL BIAS
OVERALL BIAS: BULLISH - The bias is modest. The trend indicators are firmly bearish (−DI 43.3, CMF -0.162, MACD widening), but price is a stretched 27% below EMA21 and outside the lower Bollinger Band with RSI at 27. That favours a partial relief bounce toward ~$169 over the 44 days, with resistance at the SMA200D ($184.52) and a break below $157 invalidating the call.
This is educational analysis and not financial advice.