MRVL 34-day bearish forecast — Nov 15, 2026
- Bias: Bearish
- Timeframe: 34 days (made Nov 15, 2026, target date Dec 18, 2026)
- Price at analysis: $156.76
- Price target: $146.00
- Expected range: $132.00 – $160.00
- Result: Pending — graded after the close on Dec 18, 2026
Get a free AI analysis of MRVL today
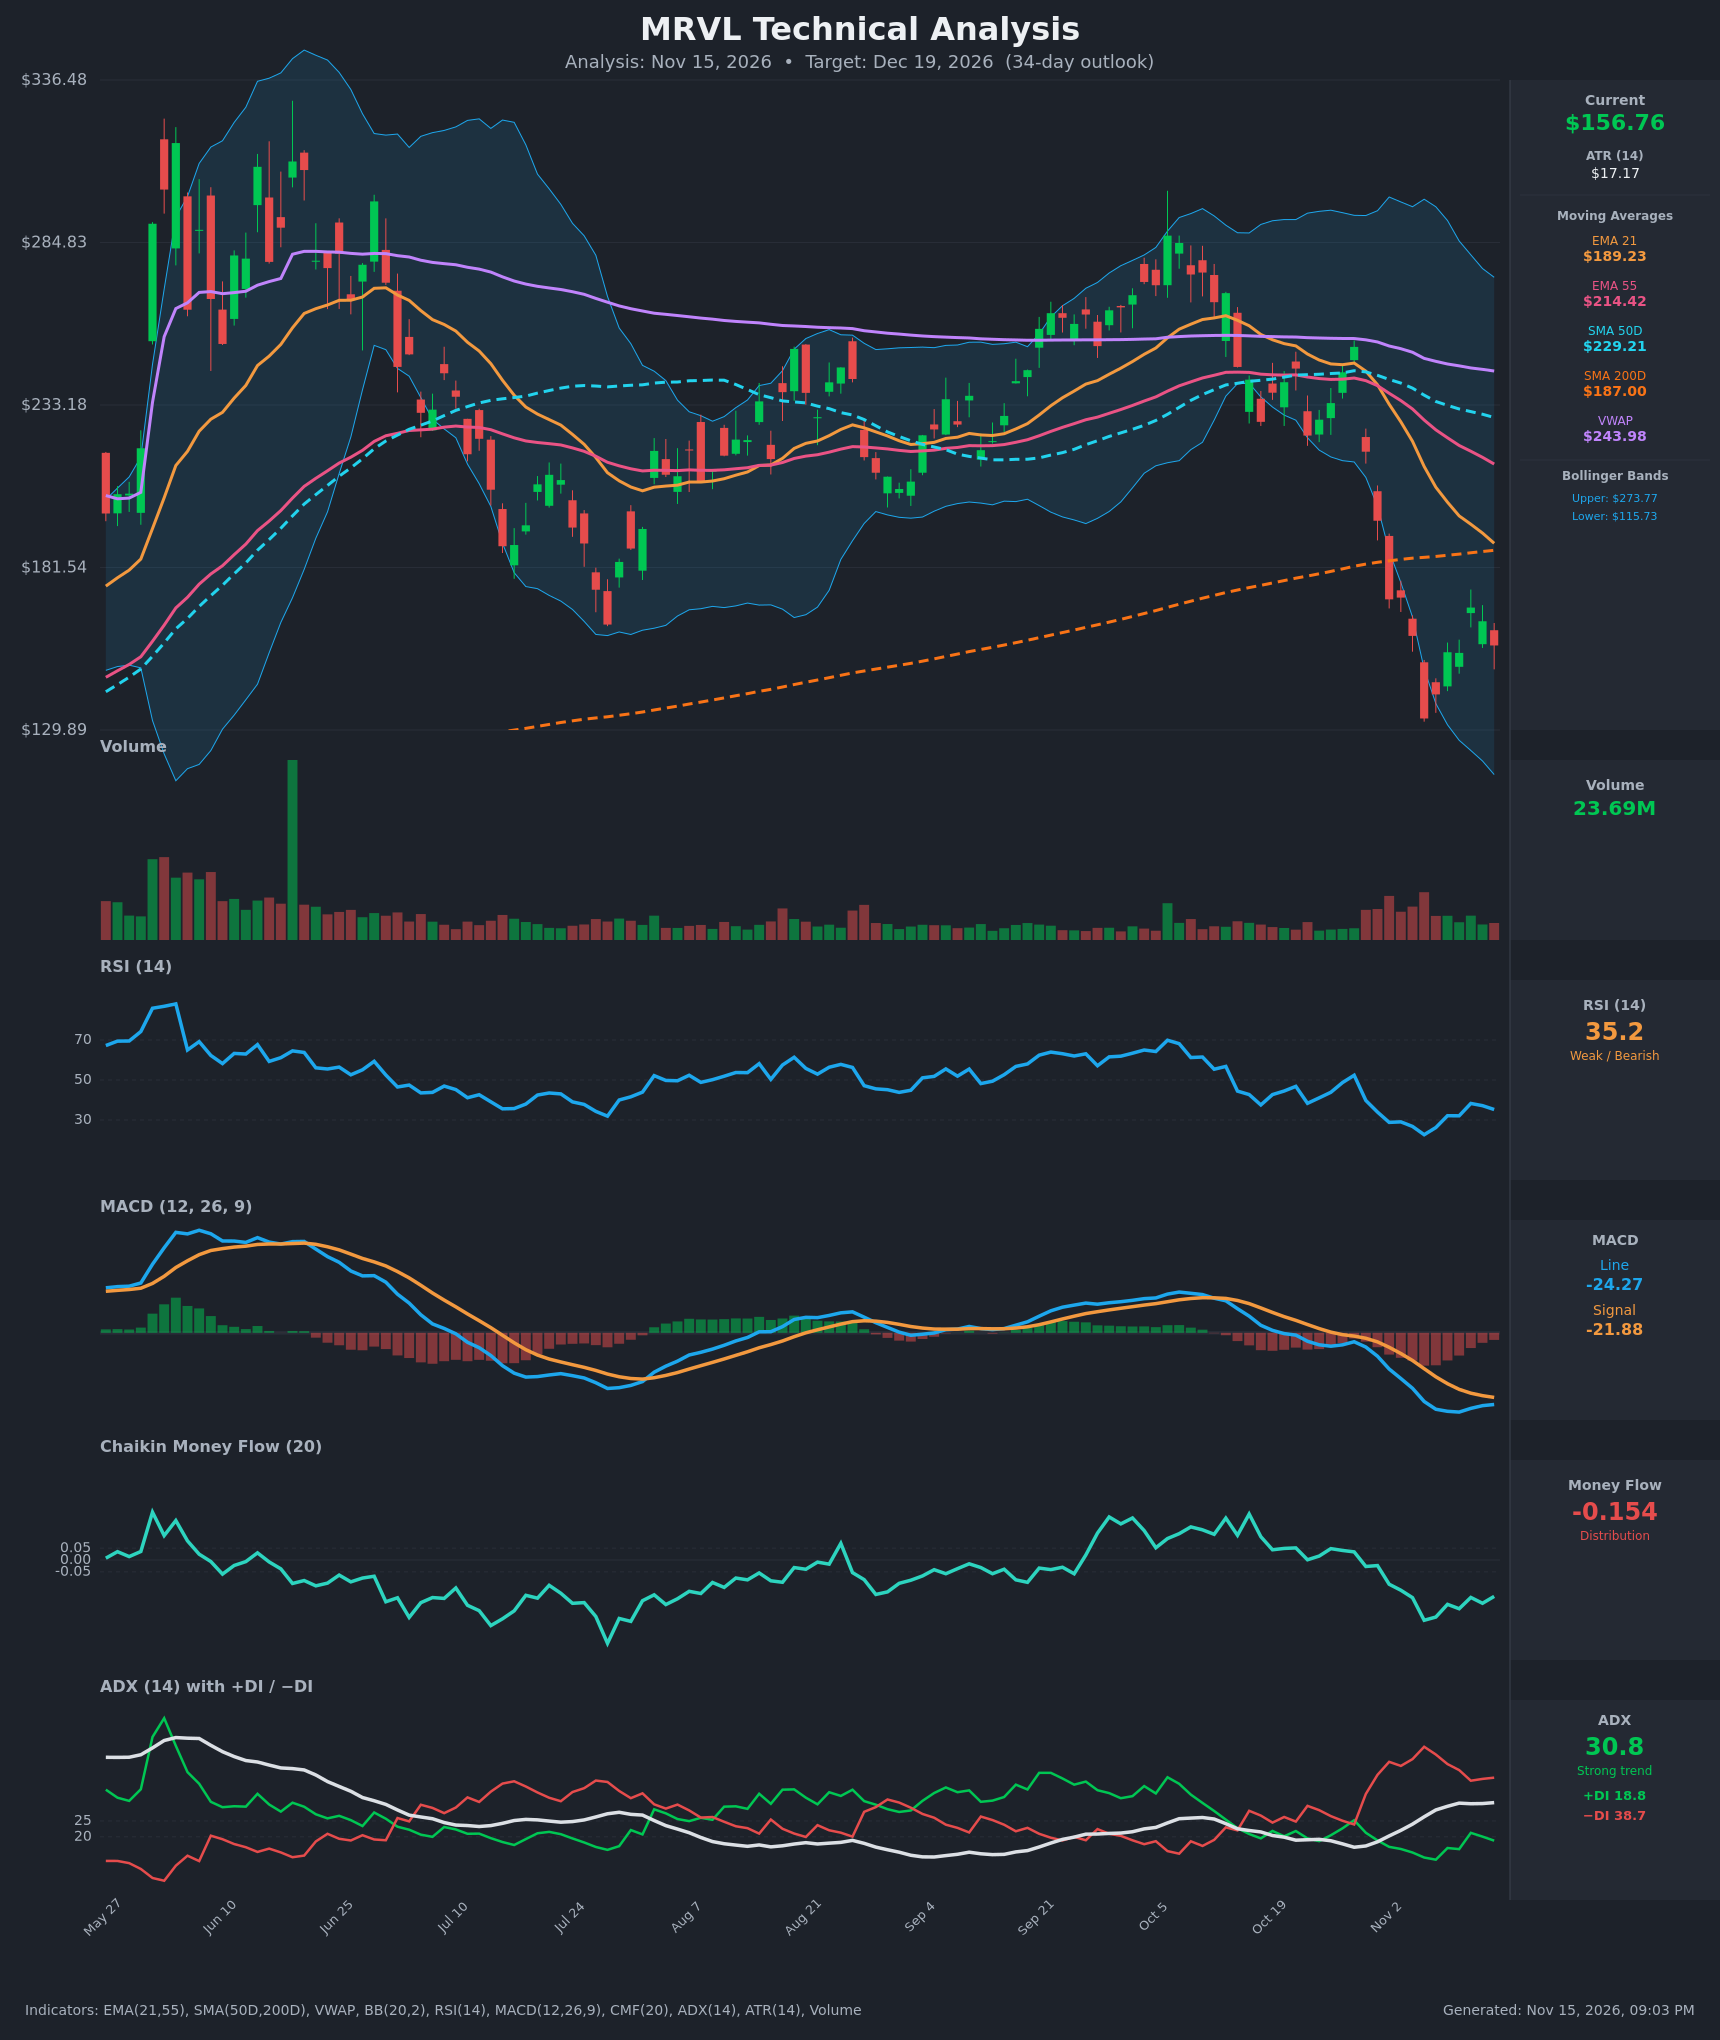
Analysis
TECHNICAL INDICATORS
- RSI (14): 35.25, down from 52 in late October and just above the 22.6 oversold extreme on Nov 5. It has bounced off the lows but is still below 40 with no move back above 50, so momentum remains weak. [Bearish]
- 20 EMA: The 21 EMA is $189.23, about 17% above price, and it is falling steeply. The 21 EMA crossed below the 55 EMA ($214.42) around Nov 2. Price has been below it since Oct 29, so it acts as overhead resistance. [Bearish]
- MACD: Line is -24.27 and signal is -21.88, so the line is below the signal and both are deeply below zero. The histogram is -2.39, much less negative than the -7.7 on Nov 10, so downside momentum is decelerating and a bullish crossover is possible. For now the signal is still bearish. [Bearish]
- Bollinger Bands (20): Upper is $273.77 and lower is $115.73, so the bands are very wide after the volatility spike. Price at $156.76 sits in the lower half, well under the midline (about $195). It touched the lower-band area on Nov 5 ($133.55) and has bounced without reclaiming the mean. [Bearish]
- CMF (20): -0.154, well below the -0.05 threshold. It has been negative since Oct 29 and bottomed near -0.255, so it is improving slightly but still shows sustained selling pressure. [Distribution]
- ADX (14): 30.8 and rising (from 17 in late October), with −DI at 38.7 far above +DI at 18.8. The bears have been in control since the Oct 29 DI crossover, and this is a strong downtrend. [Strong Trend – Bearish]
- Volume: 23.69M. Volume spiked on the late-October selloff candles and is lower on the recent bounce. Heavy volume on the down legs and lighter volume on the rebound is typical of a relief bounce within a downtrend. [Bearish]
DIVERGENCES & TRENDS
- Moving averages: Price is below the 21 EMA, 55 EMA, 50D SMA ($229.21), 200D SMA ($187.00) and VWAP ($243.98). The 21/55 EMA bearish cross is already in place. The 50D SMA is falling toward the rising 200D SMA, so a death cross is a real risk in the coming weeks.
- Long-term trend: Price broke below the 200D SMA in early November. The 200D, now around $187, is flipped to resistance.
- MACD: The line is still below the signal, but the histogram is shrinking. This is early evidence of slowing downside momentum rather than a reversal.
- RSI: The oversold reading of 22.6 on Nov 5 was followed by a bounce. Price is now back near the Nov 9–10 levels ($154) with RSI around 32–35, so there is no clear price/RSI divergence. The rebound has so far been corrective.
- ADX/DI: ADX is rising with −DI dominant. Trend strength favors continuation lower, although +DI has ticked up slightly from its low.
- CMF: It is consistently negative, with only a modest recovery from -0.255.
CHART PATTERNS
- Bearish Flag / Pennant (continuation): After the sharp drop from about $250 to $133.55, the bounce to $168.80 and the current consolidation near $155–165 resemble a bearish flag or pennant. A breakdown below the Nov 5 low of $133.55 would imply a measured move toward roughly $110–115. That is near the lower Bollinger Band ($115.73) and about 60% of the full flagpole.
- Possible Double Bottom (reversal, speculative): The $133.55 low and a retest of the area would form a double bottom only if the retest holds on lower volume and price then breaks above $168.80. That is not yet confirmed, and the neckline sits well below the 200D SMA and 21 EMA.
- Broader structure: The prior range of roughly $210–$290 failed. The break below it and the 200D SMA is a bearish distribution-to-markdown structure.
POTENTIAL SCENARIOS
- Scenario 1: Bearish Flag Breakdown / Trend Continuation — The bounce fades under the declining 21 EMA and the 200D SMA, and sellers push price back toward the November low. Trigger: Rejection at $168–175 or a close below $150 with expanding volume. Target: $135–$140, with an extension toward $120 if the $133.55 low breaks. Invalidation: Daily close above $190 (21 EMA / 200D SMA). (50% probability)
- Scenario 2: Bullish Oversold Relief Rally — The MACD histogram keeps shrinking, a bullish crossover occurs and RSI reclaims 50. Price squeezes up into the moving-average cluster. Trigger: Close above $168.80 followed by a push over $175 on rising volume. Target: $187–$190 (200D SMA and 21 EMA). Invalidation: Close below $133.55. (33% probability)
- Scenario 3: Neutral Basing Range — Price consolidates between the $133.55 low and the $168.80 high as selling exhausts but buyers lack follow-through. Trigger: Several sessions of inside-range closes with ADX falling below 25. Target: $145–$160. Invalidation: Close outside the $133–$169 range. (17% probability)
PRICE TARGETS
- Target Price: $146.00 (34-day, about -6.9% from the current $156.76)
- Expected Range: $132.00 to $160.00 (width $28.00, about 17.9% of current price, in line with the 12–18% guidance for 30–60 days)
- Key Levels: Support at $133.55 (Nov 5 low), Resistance at $168.80 (Nov 11 high close), with major overhead resistance at the 200D SMA / 21 EMA near $187–$189
OVERALL BIAS
OVERALL BIAS: BEARISH - Price is below every major moving average and VWAP, −DI dominates a strong ADX of 30.8, CMF shows persistent distribution and the 21/55 EMA cross is bearish. The rebound looks like a relief bounce or bear flag, so a retest of the $133–$140 area is more likely than a recovery to the $187 resistance, though the shrinking MACD histogram leaves room for a bounce.
This is educational analysis and not financial advice.