NET 43-day bearish forecast — Nov 5, 2026
- Bias: Bearish
- Timeframe: 43 days (made Nov 5, 2026, target date Dec 18, 2026)
- Price at analysis: $240.29
- Price target: $227.00
- Expected range: $208.00 – $255.00
- Result: Pending — graded after the close on Dec 18, 2026
Get a free AI analysis of NET today
Analysis
TECHNICAL INDICATORS
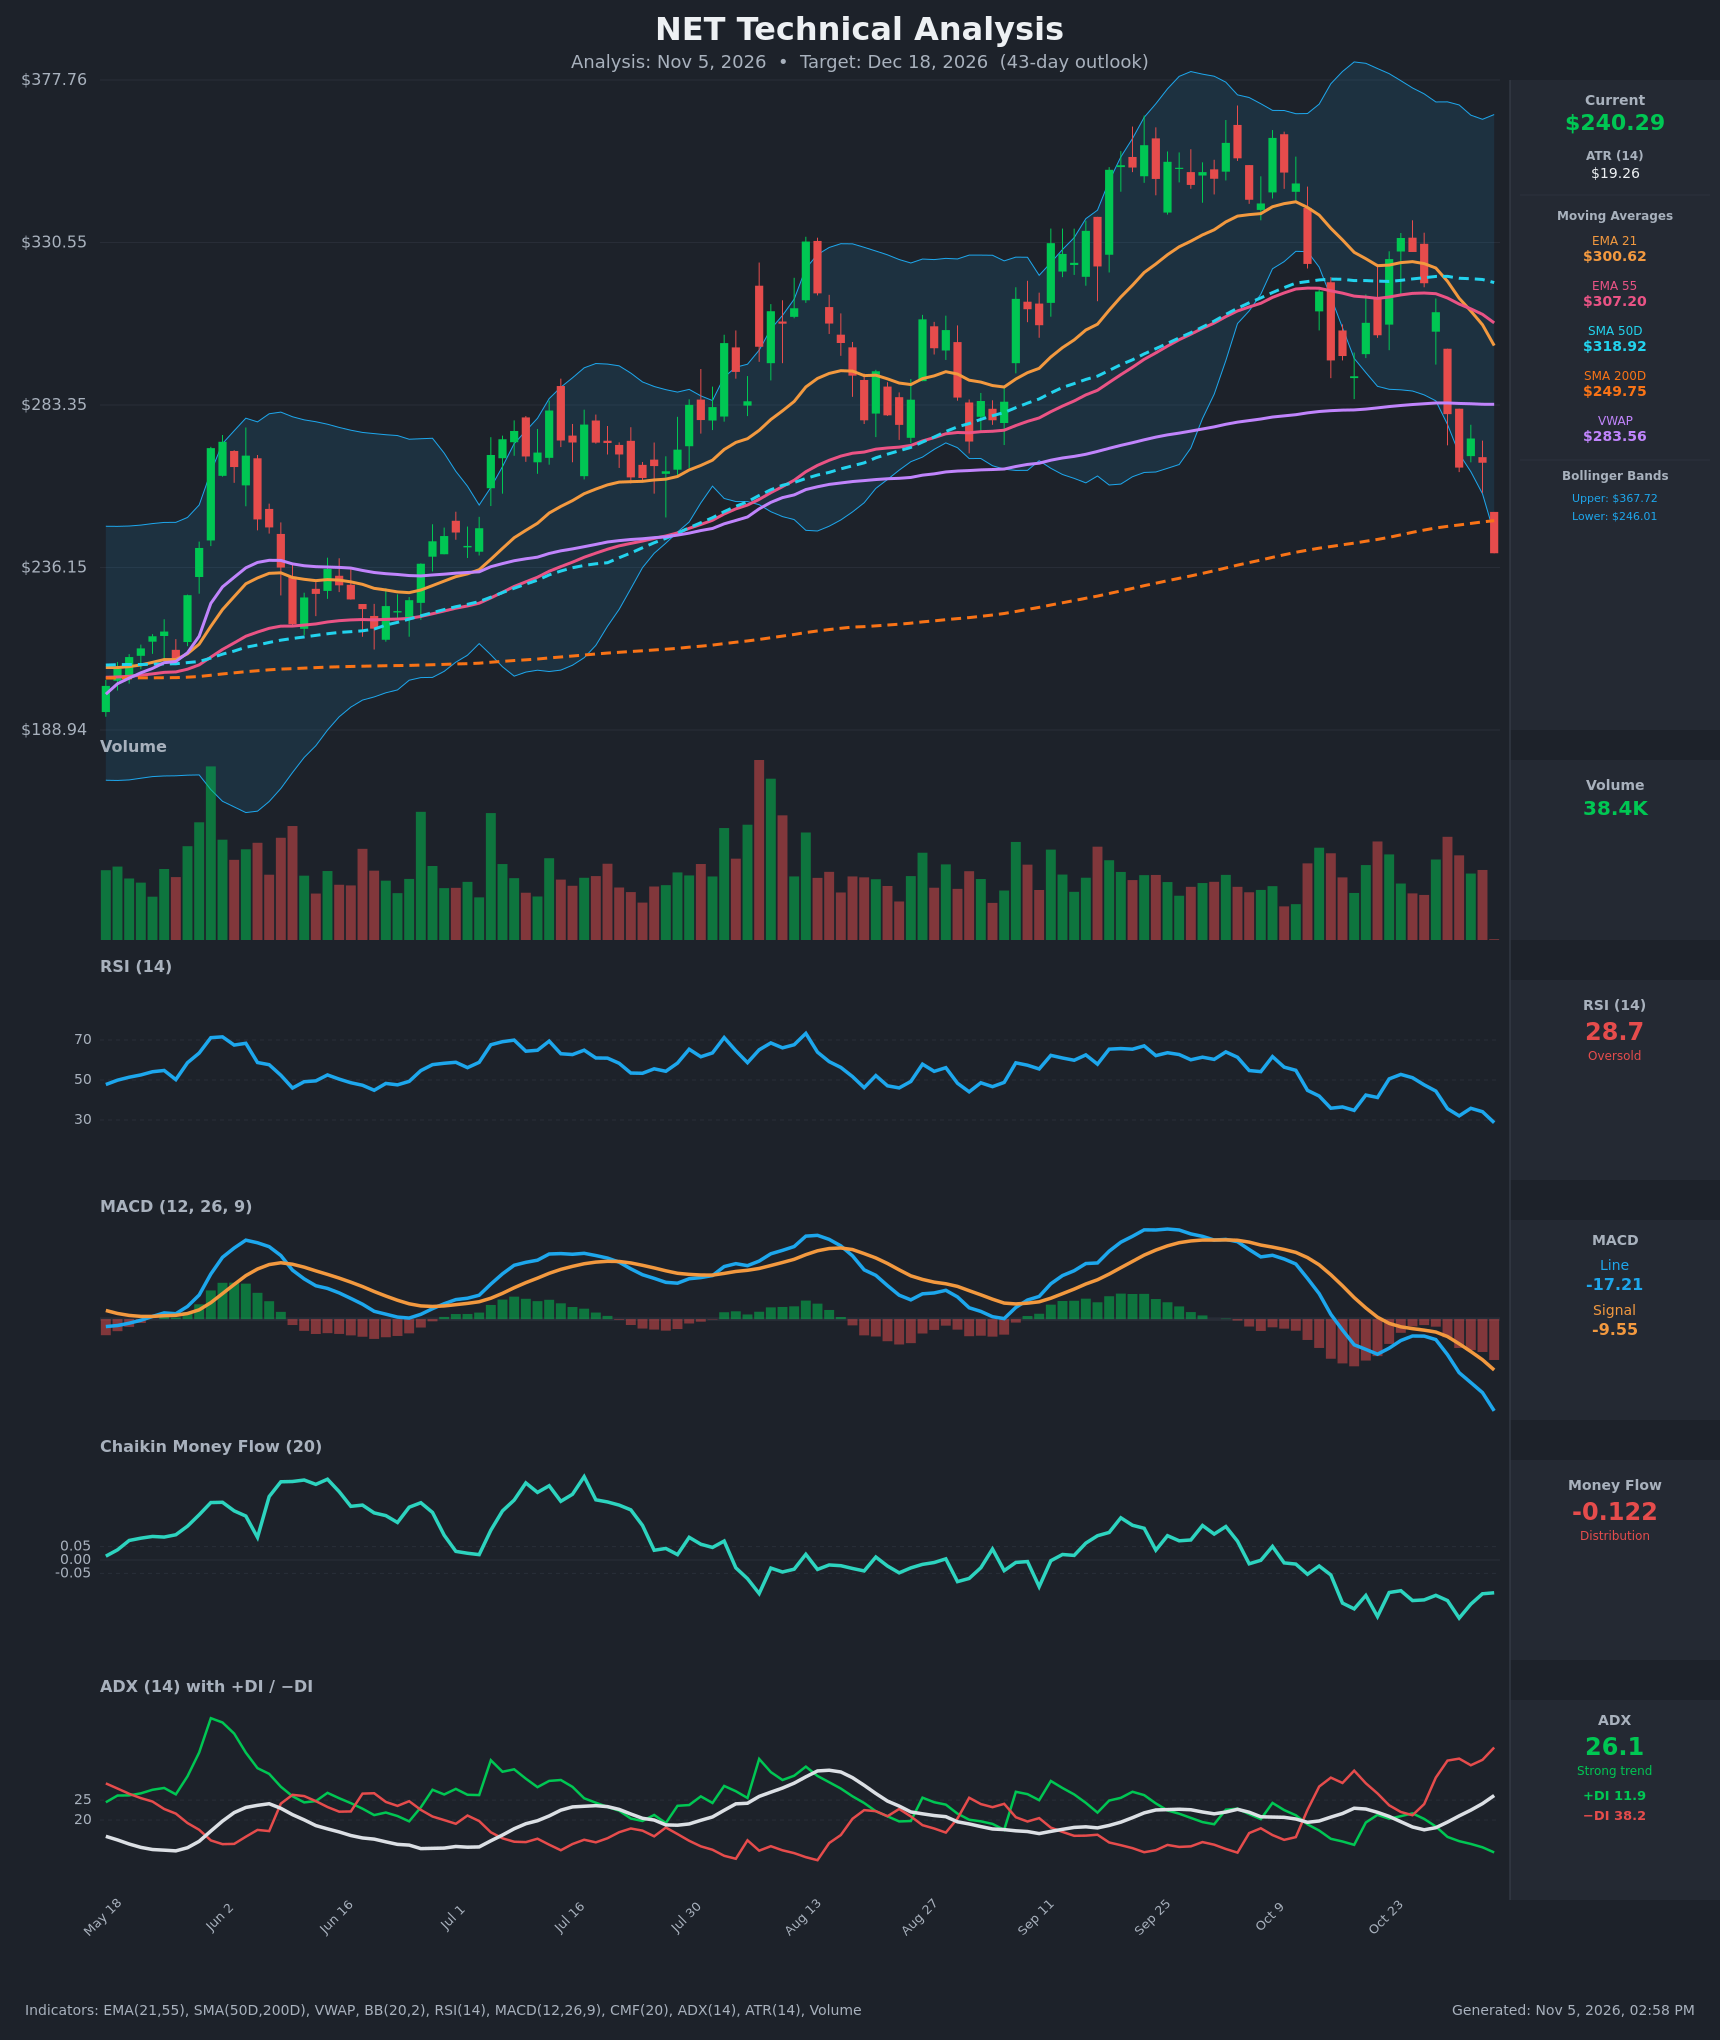
- RSI (14): 28.66, in oversold territory and falling steeply from about 52 on Oct 26. Momentum is clearly down and has not yet shown a bullish turn. Oversold readings can trigger relief bounces, but in a strong downtrend RSI can stay depressed. [Bearish]
- 20 EMA: The 21 EMA is $300.62 and price at $240.29 sits about 20% below it. It is falling and has crossed below the EMA55 ($307.20), a bearish crossover around Nov 3. The EMA21 is now overhead resistance. [Bearish]
- MACD: Line at -17.21 is below signal at -9.55 and the gap is widening. The histogram is increasingly negative. The bearish crossover happened around Oct 23, and momentum is accelerating down. [Bearish]
- Bollinger Bands (20): Upper $367.72, lower $246.01. Price at $240.29 is below the lower band, a statistically stretched move. The bands are wide, so volatility is elevated. A close below the band in a trending market often signals continuation, though a reversion bounce toward the mid-band is possible. [Bearish]
- CMF (20): -0.122, well below -0.05 and in sustained distribution since roughly August. The selling pressure is persistent. [Distribution]
- ADX (14): 26.1 and rising, with −DI (38.2) far above +DI (11.9). That is a strong, intensifying downtrend with bears in firm control. [Strong Trend – Bearish]
- Volume: 38.4K on the latest bar. Recent red candles have come with above-average volume (the Oct 30–Nov 5 selloff), showing conviction in the decline. The latest reading is modest and may reflect a partial bar. [Bearish – selling with volume]
DIVERGENCES & TRENDS
- No bullish RSI divergence yet. RSI is making new lows alongside price, which confirms the downtrend.
- MACD, RSI, CMF and ADX/DI all point down together, with no conflict between the indicators.
- Price has lost every key moving average: EMA21, EMA55, SMA50D ($318.92) and VWAP ($283.56). It has fallen from about $332 on Oct 26 to $240, roughly -28% in 8 sessions.
- Price is now testing the SMA200D at $249.75 and has closed just below it. Losing the long-term average is a major bearish signal if it holds.
- The SMA50D is still above the SMA200D, so there is no death cross yet, but the 50D is rolling over and the gap is narrowing.
- CMF has been negative for months, which preceded the breakdown.
CHART PATTERNS
- Bearish Head and Shoulders / Double Top (reversal): The advance to about $360 in September and early October, followed by a lower high near $332 on Oct 26 and a sharp breakdown, resembles a topping structure. The neckline near $280–$300 has been broken, with a measured move toward about $220–$240 or lower.
- Failed consolidation: The Oct 9–Oct 26 bounce into the $325–$332 area failed at the declining EMAs and the 50D.
- The long-term uptrend since May is now challenged. The SMA200D at about $250 and the prior base at $210–$236 are the next supports.
- Price at the lower Bollinger Band with RSI under 30 raises the odds of a short-term bounce. Any rally likely meets resistance at $265–$283 (VWAP) and would be a bear-market rally.
POTENTIAL SCENARIOS
- Scenario 1: Bearish Continuation Toward Prior Base — The SMA200D fails, and ADX, MACD and distribution keep selling pressure intact. Price drifts down to the $205–$225 zone, the May–July base and the lower end of the measured move. Trigger: daily close below $236 with sustained −DI dominance. Target: $215. Invalidation: close back above $283 (VWAP). (50% probability)
- Scenario 2: Bearish Relief Bounce Then Roll Over — An oversold bounce from RSI under 30 lifts price toward $265–$285, where the SMA200D, VWAP and falling EMAs cap it. Price then fades back to the mid-$230s to $240s. Trigger: RSI turns up from below 30 with a hold above $236. Target: $265–$280 first, then $235. Invalidation: weekly close above $300 (EMA21). (30% probability)
- Scenario 3: Bullish V-Reversal — Capitulation at the SMA200D and lower band marks the low. Price reclaims $283 and then $300. Trigger: bullish RSI divergence with a MACD histogram turn and volume surge above $265. Target: $300–$305. Invalidation: close below $225. (20% probability)
PRICE TARGETS
For a 43-day horizon, the range should be about 12–18% of the current price ($240.29), a width of about $29–$43. Because ATR is elevated at $19.26, I use the wider end, roughly 19%: $205.00 to $250.00 would be $45 wide, so I shorten it to $208.00 to $255.00 ($47 wide, ~19.6%), in line with the volatility.
- Target Price: $227.00 (43 days, Dec 18, 2026)
- Expected Range: $208.00 to $255.00 (width $47, ~19.6% of the current price)
- Key Levels: Support at $225.00 (psychological level and the base near $236 to $210), Resistance at $249.75 (SMA200D, followed by $283.56 VWAP)
OVERALL BIAS
OVERALL BIAS: BEARISH - Price is below all key moving averages and the lower Bollinger Band, with MACD falling, −DI far above +DI, ADX rising above 25 and persistent CMF distribution. An oversold bounce is possible, but the breakdown of the SMA200D and the topping structure favor lower prices over 43 days.
This is educational analysis and not financial advice.