NET 48-day bullish forecast — Nov 10, 2026
- Bias: Bullish
- Timeframe: 48 days (made Nov 10, 2026, target date Dec 28, 2026)
- Price at analysis: $302.84
- Price target: $316.00
- Expected range: $288.00 – $336.00
- Result: Pending — graded after the close on Dec 28, 2026
Get a free AI analysis of NET today
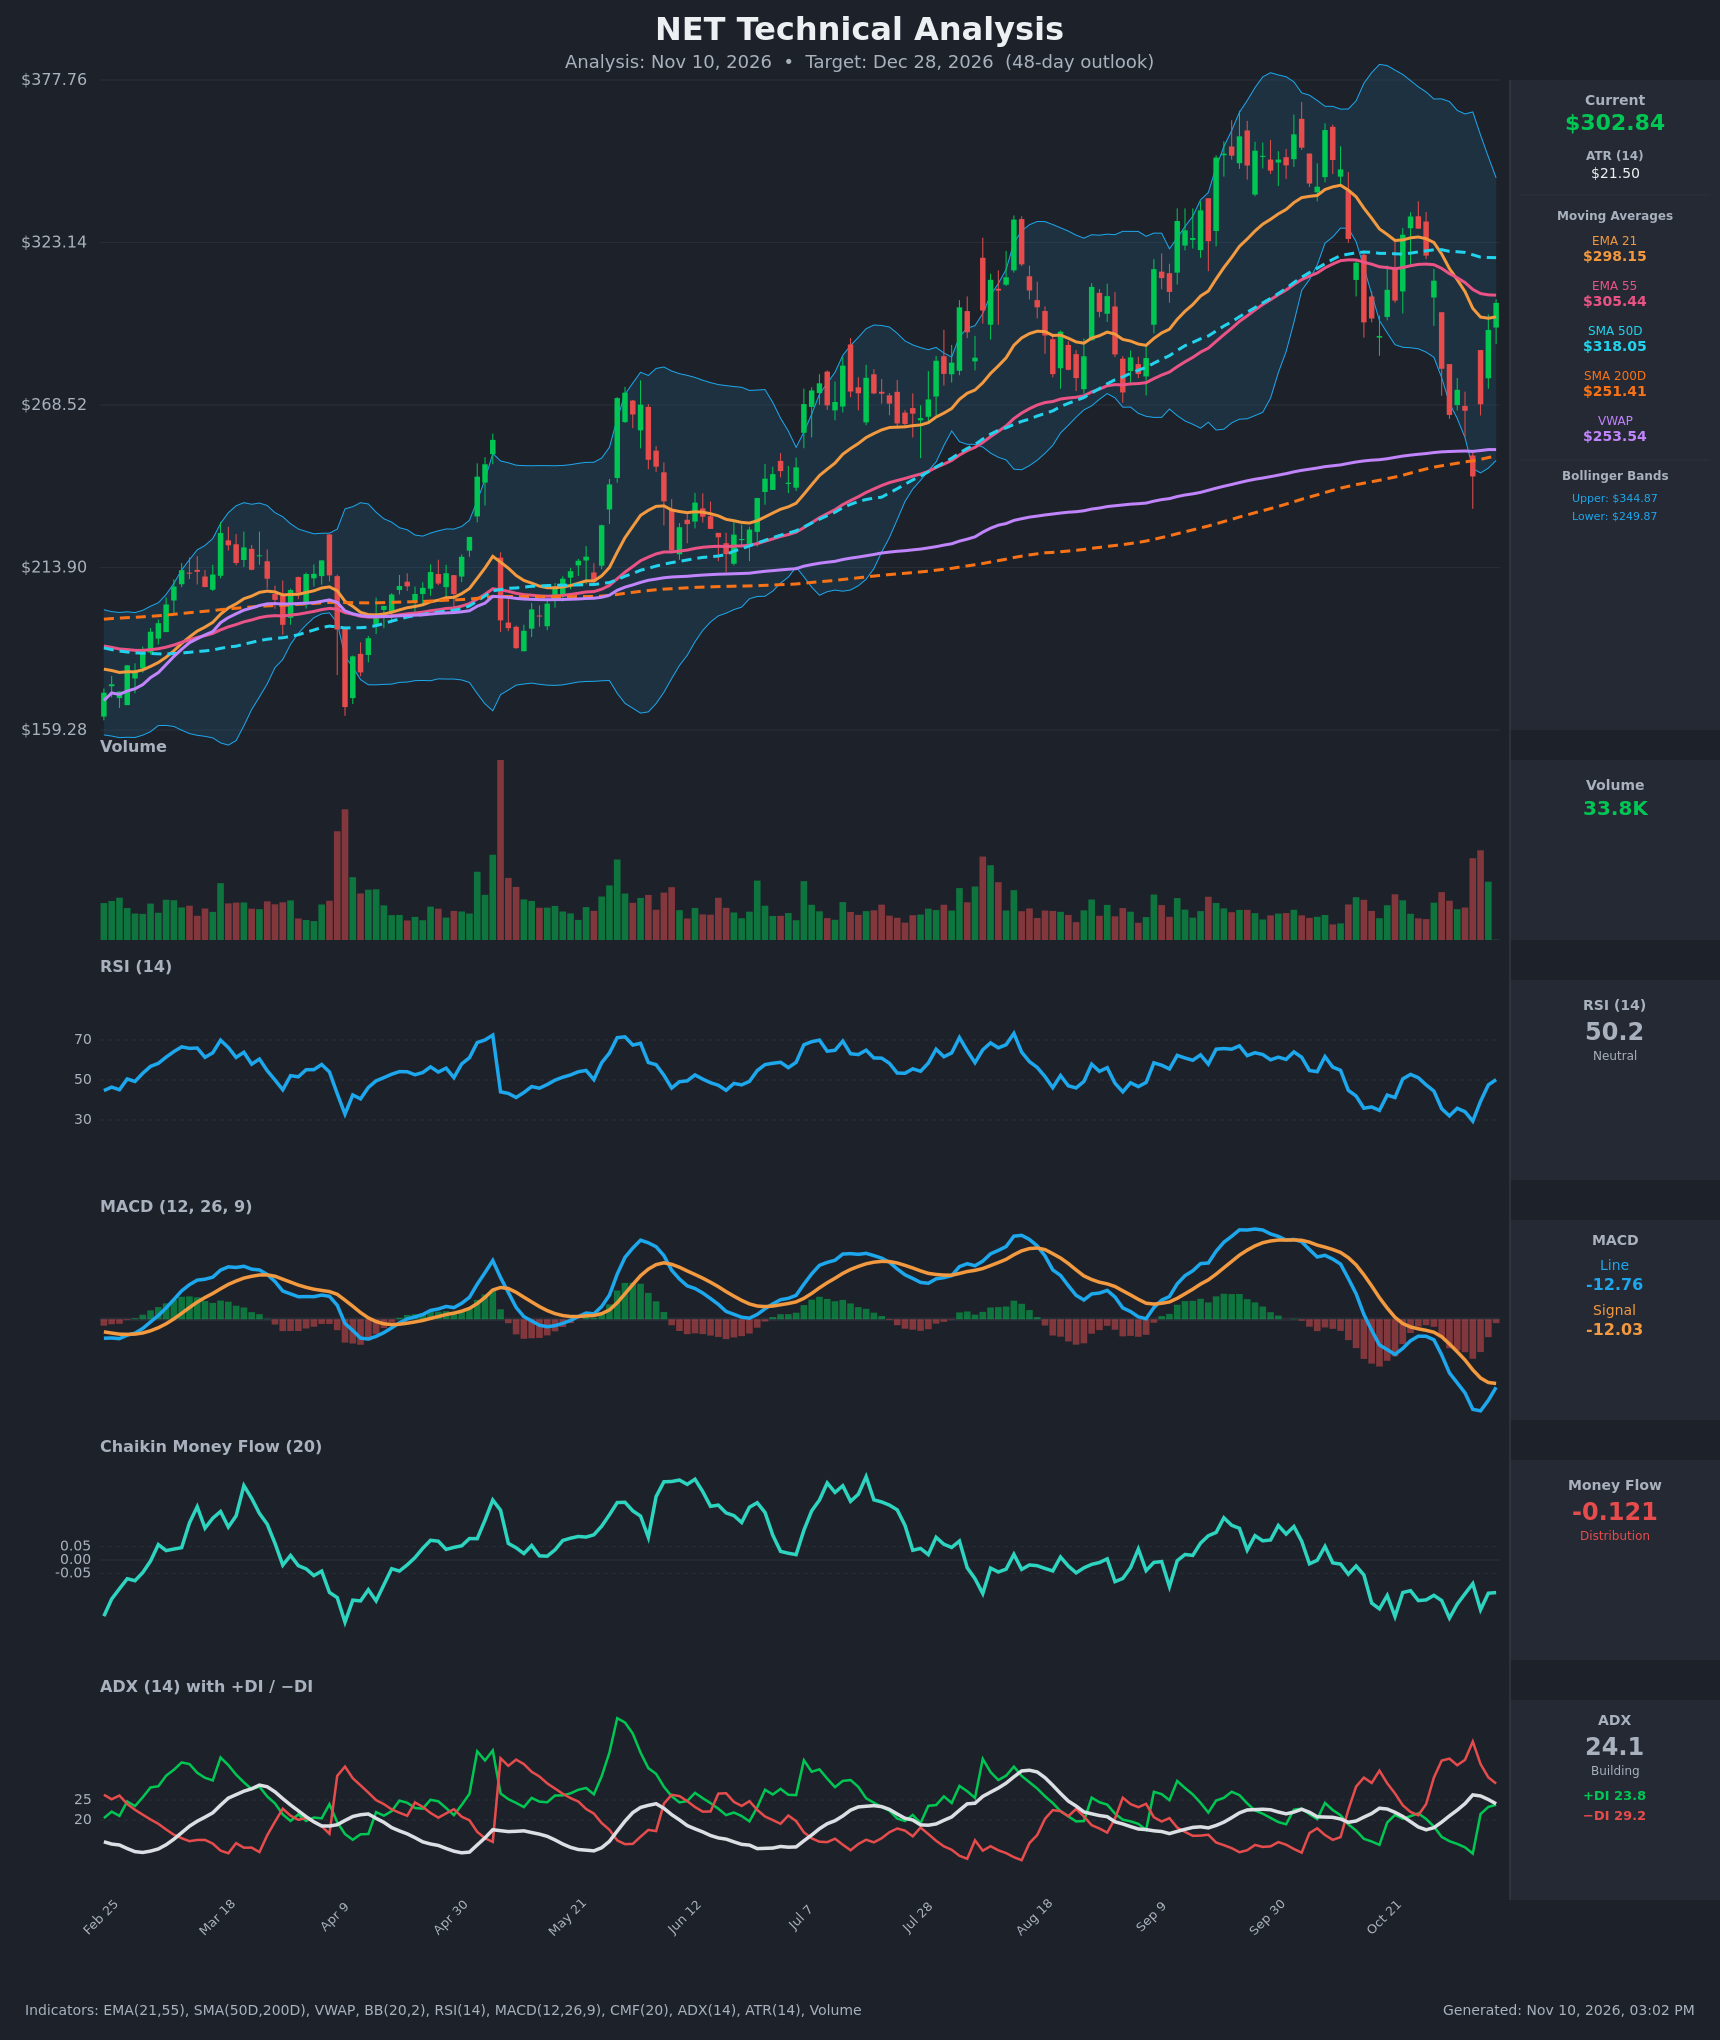
Analysis
TECHNICAL INDICATORS
- RSI (14): 50.18, up from the 29.4 oversold low on Nov 5 and now back at the midline. Momentum has recovered sharply but is not yet strong. [Neutral]
- 20 EMA (EMA 21): $298.15, with price at $302.84 just above it, so it is acting as near-term support. EMA21 is still below EMA55 ($305.44), a bearish alignment, and price is below SMA50D ($318.05). Price is above the rising SMA200D ($251.41), so the long-term uptrend is intact. [Neutral]
- MACD: Line -12.76 is below Signal -12.03, a histogram of about -0.72. The line has turned up from -17.16 and the histogram is shrinking quickly, so a bullish crossover looks close. Both lines are still deeply negative, so the crossover is not confirmed. [Neutral]
- Bollinger Bands (20): Upper $344.87, lower $249.87, midline about $297. Price bounced from the lower band (the Nov 5 low of $244.51 pierced it) and is now back above the midline. The bands are wide after the October selloff, which fits ATR of $21.50. [Bullish]
- CMF (20): -0.121, well below -0.05. Selling pressure has persisted for weeks, and the bounce has not yet brought buyers back. [Distribution]
- ADX (14): 24.1 and falling from 26.3, with -DI (29.2) above +DI (23.8). The bearish trend is weakening, and the DI gap has narrowed from about 28 points to 5. A +DI/−DI crossover is plausible within days. [Weak Trend, bearish fading]
- Volume: 33.8K, with heavy volume on the late-October selloff and the Nov 5 capitulation. The recent green candles also have above-average volume, suggesting dip buying. [Constructive, but not yet decisive]
DIVERGENCES & TRENDS
- RSI made a higher low (29.4 on Nov 5, versus 32.1 on Nov 2), while price also made a lower low at $244.51. This is a mild sign of selling exhaustion, not a full divergence.
- MACD is curling up with a shrinking negative histogram, a classic early momentum-recovery signal. No bullish crossover has happened yet.
- Price has gained 24% in 3 sessions ($244.51 to $302.84) and retraced about 70% of the Oct 30–Nov 5 drop. That is a V-shaped recovery that now meets a resistance cluster.
- CMF stays negative and has not confirmed the bounce, which is a bearish caution. The rally has not yet been matched by accumulation.
- Price reclaimed EMA21 and is testing EMA55 ($305.44). SMA50D ($318.05) is flattening and turning down slightly.
- There is no golden or death cross. SMA50D remains well above SMA200D, so the long-term structure is bullish. The 200D and VWAP (~$253) sit far below as major support.
- Peak structure is a lower high ($331.86 in October versus about $372 in September), so the higher-timeframe trend has been losing steam.
CHART PATTERNS
- V-shaped recovery from the lower Bollinger Band: This is not a formal diagram pattern, but it often precedes a retest of the breakdown zone.
- Possible bearish rising-wedge/head-and-shoulders character on the broader chart: The September peak (~$372) and October lower high (~$332) loosely resemble a head and shoulders. The neckline around $245–$250 held on the Nov 5 test, which is a base for the structure, not a breakdown.
- Possible bullish double-bottom base: The lows are Nov 5 ($244.51) and the earlier October dip. Price must clear $318–$332 to confirm, which would project a measured move toward $340+.
- Significance: The most likely outcome is a consolidation or retest between the $265 base and the $318–$332 resistance band, with a modest upward lean while price holds above EMA21.
POTENTIAL SCENARIOS
- Scenario 1: Bullish Recovery Toward SMA50D and Beyond — The bounce holds above EMA21, MACD crosses up, and +DI retakes −DI as CMF improves. Price clears the $305–$318 resistance cluster. Trigger: daily close above $318.05 with MACD bullish crossover. Target: $316–$332, with an extension to about $340. Invalidation: daily close below $293. (45% probability)
- Scenario 2: Bearish Failed Bounce and Retest of Lows — Price is rejected at EMA55/SMA50D, persistent distribution (CMF < -0.05) continues, and −DI stays dominant. Price rolls over into the lower Bollinger Band area. Trigger: rejection at $305–$318 followed by a close below $293. Target: $265, then $245–$250. Invalidation: close above $320. (35% probability)
- Scenario 3: Neutral Choppy Consolidation — Price oscillates between about $280 and $320 as ADX stays below 25 and the market digests the volatility. Trigger: no decisive close beyond either band. Target: $295–$310. Invalidation: close outside $275–$325. (20% probability)
PRICE TARGETS
- Target Price: $316.00 (48-day, to Dec 28, 2026)
- Expected Range: $288.00 to $336.00 (width $48 ≈ 15.8% of current price, in line with the 30–60 day guidance of ~12–18%)
- Key Levels: Support at $293.75 (Nov 9 close, with EMA21 at $298.15 just above), Resistance at $318.05 (SMA50D, with EMA55 at $305.44 as the first hurdle)
OVERALL BIAS
OVERALL BIAS: BULLISH - The V-shaped recovery has reclaimed EMA21 and the Bollinger midline, price sits above the rising SMA200D, and RSI, MACD and ADX are all turning up. The bias is modest because CMF still shows distribution, EMA21 is below EMA55, and the $305–$332 resistance cluster must be cleared.
This is educational analysis and not financial advice.