TEAM 46-day bearish forecast — Nov 6, 2026
- Bias: Bearish
- Timeframe: 46 days (made Nov 6, 2026, target date Dec 22, 2026)
- Price at analysis: $157.01
- Price target: $148.00
- Expected range: $135.00 – $162.00
- Result: Pending — graded after the close on Dec 22, 2026
Get a free AI analysis of TEAM today
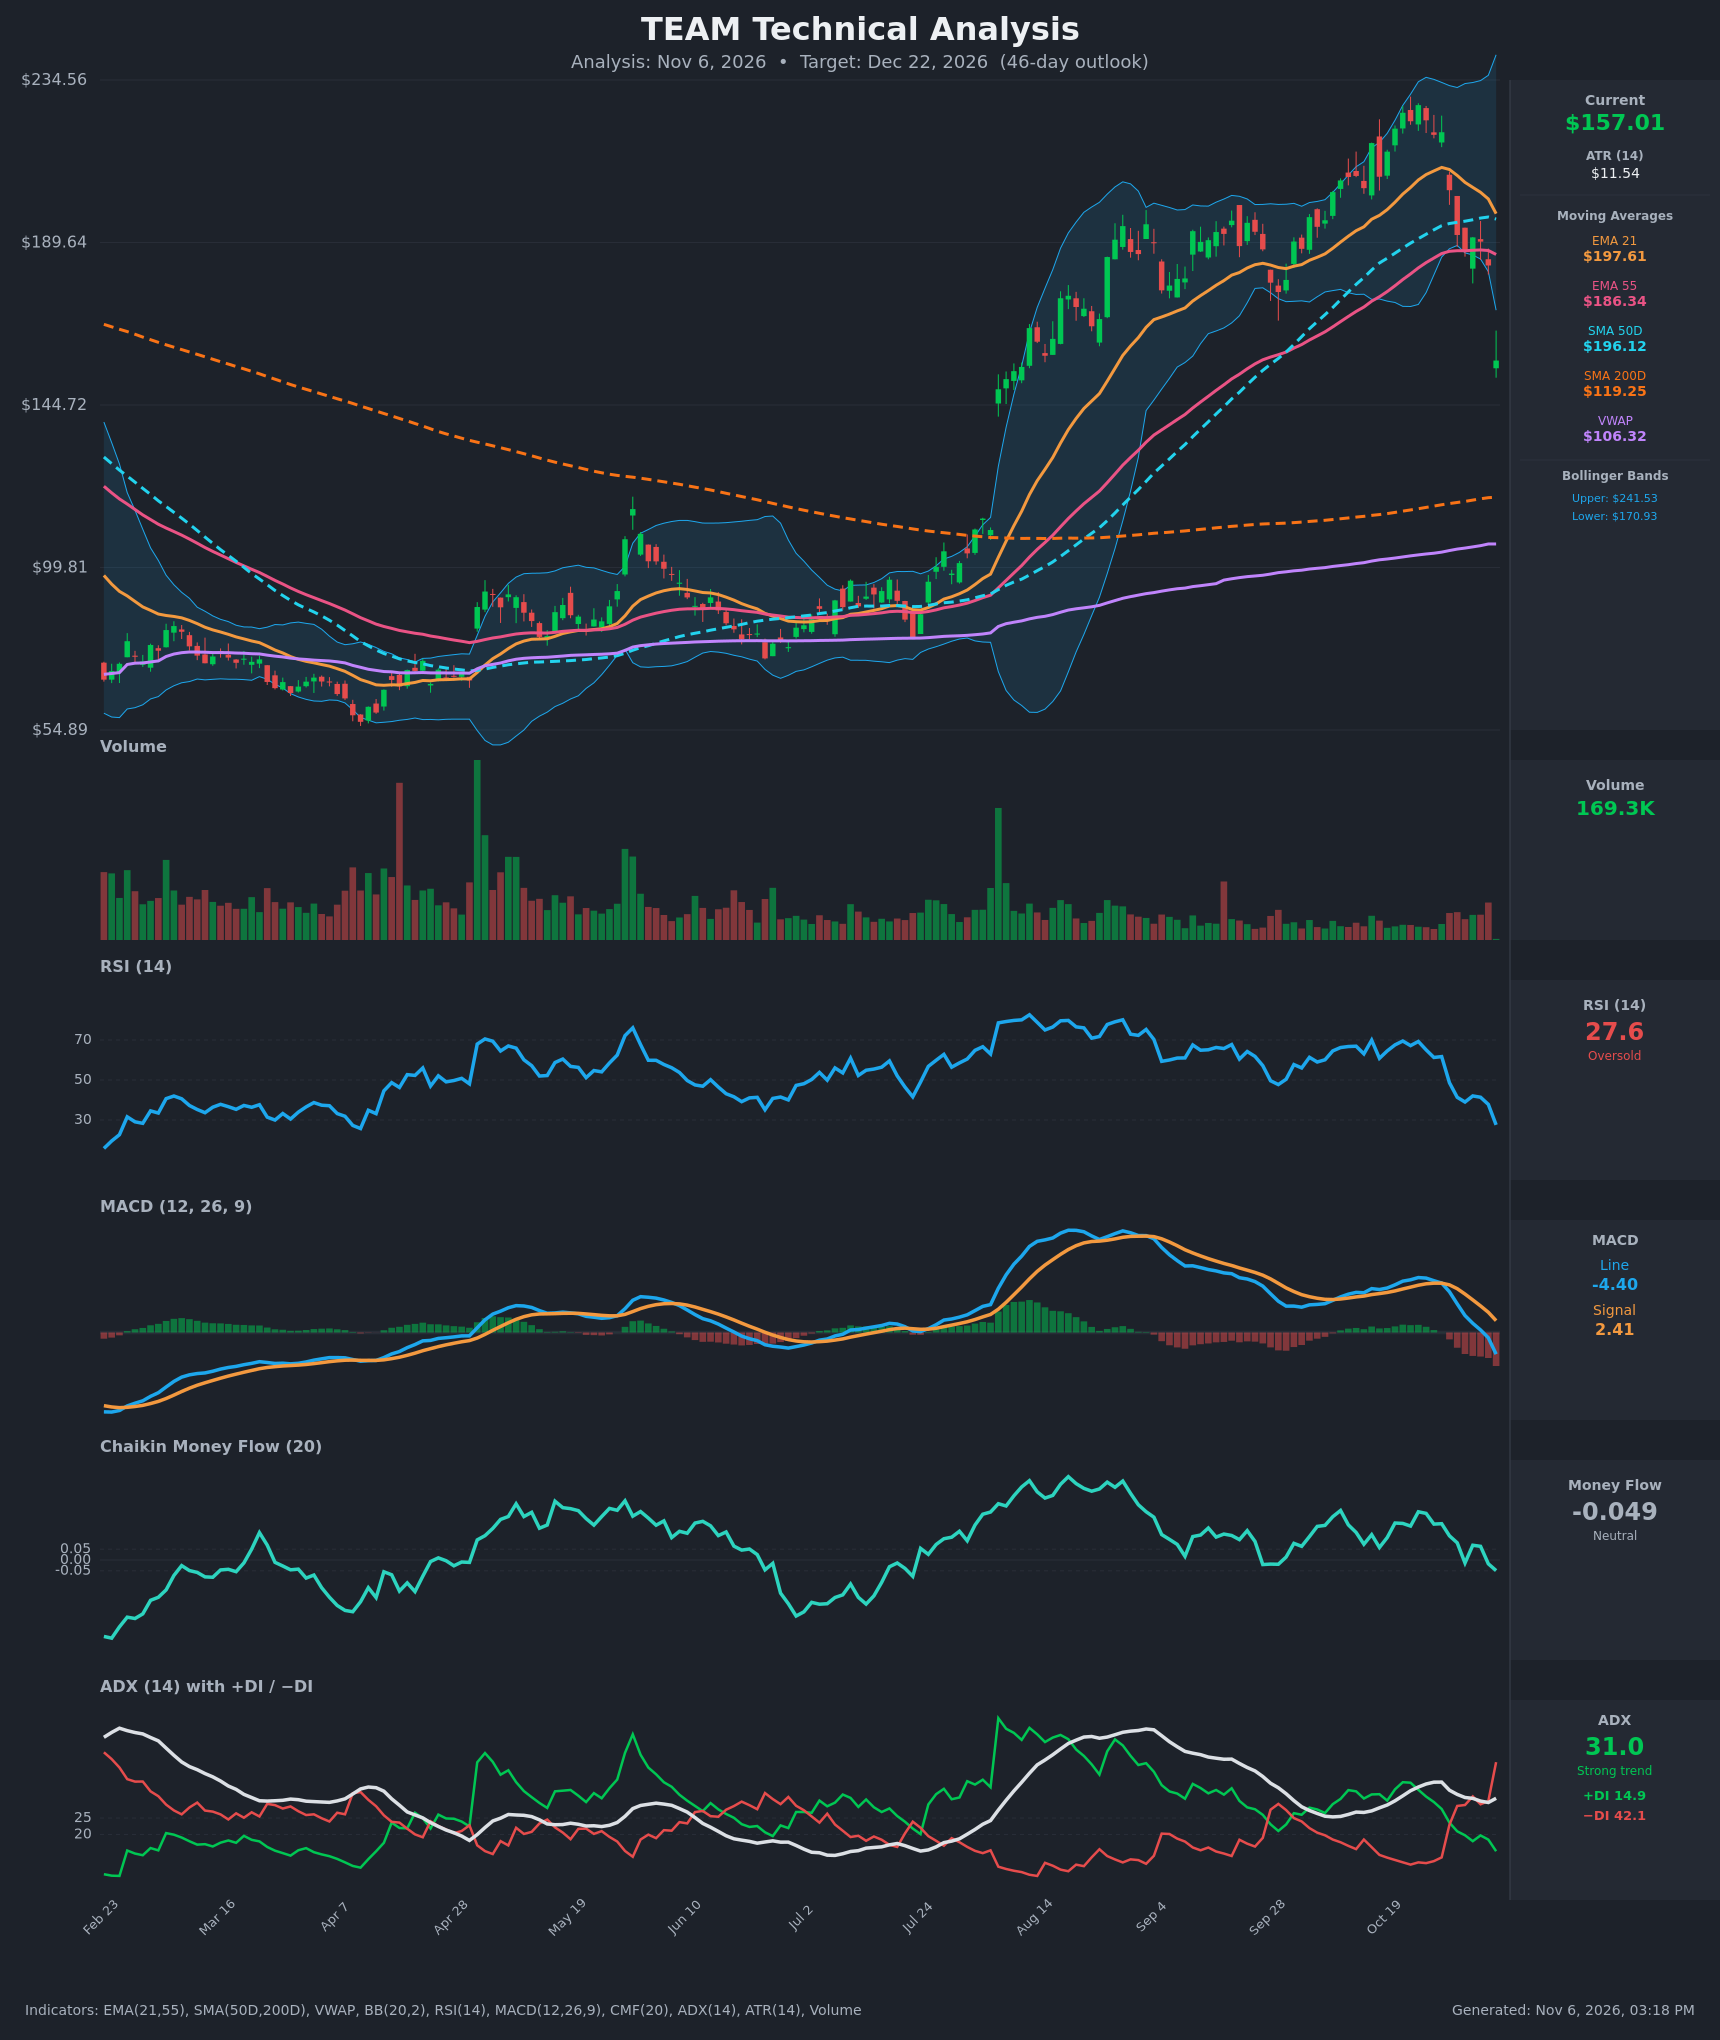
Analysis
TECHNICAL INDICATORS
- RSI (14): 27.57, in oversold territory. It fell from about 69 on Oct 23 to 27.6 and is making its lowest reading since April. Momentum is still falling, and there is no bullish divergence yet. [Bearish]
- 20 EMA (EMA 21): $197.61, sloping down. Price at $157.01 is about 20% below it, so it acts as heavy overhead resistance. The EMA 21 is converging on the EMA 55 ($186.34), and a bearish EMA crossover looks likely within weeks. [Bearish]
- MACD: The line (-4.40) crossed below the signal (+2.41) around Nov 5-6, and the histogram is deeply negative and widening. The crossover came from a high level, which is a fresh and strong bearish momentum signal. [Bearish]
- Bollinger Bands (20): Price closed at $157.01, well below the lower band ($170.93) after a one-day gap down. The upper band is $241.53. The close is stretched about 8% below the lower band, which raises the odds of a relief bounce. Band-walking after a breakdown can also continue. [Bearish]
- CMF (20): -0.049, just inside the neutral zone and falling from +0.22 on Oct 23. It has just turned negative and sits at the edge of distribution. [Neutral]
- ADX (14): 31.0 with −DI (42.1) far above +DI (14.9). The −DI crossover happened around Oct 29-30 and the spread is widening. ADX above 25 confirms a strong trend, and the direction is down. [Strong Trend – Bearish]
- Volume: 169.3K, light compared with the spikes seen at earlier turning points. The large gap-down candle on modest volume makes the capitulation read less clean. It could still be a partial-session figure. [Neutral / Unconfirmed Selling]
DIVERGENCES & TRENDS
- No bullish divergence. RSI, MACD and price are all making new lows together, so momentum confirms price.
- Sharp trend reversal. MACD, RSI, −DI and CMF all rolled over within about 8 sessions. Price fell from $227.61 (Oct 23) to $157.01, down about 31%.
- Bearish crossovers:
- MACD crossed below its signal line.
- −DI crossed above +DI.
- Price broke below the EMA 21, EMA 55 and SMA 50D ($196.12) in one move.
- Not yet triggered: There is no death cross because the SMA 50D is far above the SMA 200D ($119.25). The EMA 21 and EMA 55 have not yet crossed bearishly, but the gap is shrinking.
- Long-term floor: Price remains above the rising SMA 200D ($119.25) and VWAP ($106.32), so the long-term structure is not broken.
- Gap overhead: The gap between roughly $170 and $183 is overhead resistance and a likely gap-fill target on any bounce.
CHART PATTERNS
- Bearish reversal context: The chart shows a rally from about $100 to $227 followed by a rounded top and a sharp breakdown. This is closest to a Bearish Head and Shoulders / Double Top-style reversal. The late-Sep to Oct highs ($225-$228) formed the peak and were followed by a break of the $183-$187 neckline-like zone.
- Measured move: The neckline sits near $185 and the top near $228, a height of about $43. Projecting down gives roughly $142, which matches the Aug-Sep consolidation base at $144.72.
- Gap-down breakdown: A large gap lower is a classic event-driven break. Gaps like this often see a dead-cat bounce into the gap, then continuation or sideways drift.
- No bullish reversal pattern yet: A Double Bottom or Falling Wedge would need a retest low with improving RSI, which is not present.
POTENTIAL SCENARIOS
- Scenario 1: Bearish Post-Gap Drift Lower — The strong downtrend (ADX 31, −DI 42) persists. After a brief bounce toward the gap, sellers push price back toward the Aug-Sep demand zone. Trigger: failure to reclaim $170.93 (the lower Bollinger Band) and a close below $150. Target: $144-$135. Invalidation: daily close above $183. (50% probability)
- Scenario 2: Bullish Oversold Relief Bounce — RSI near 27 and price far below the lower band trigger mean reversion into the gap and the EMA 55. Trigger: close above $170.93 with improving volume and CMF turning positive. Target: $178-$186 (gap fill / EMA 55). Invalidation: close back below $150. (33% probability)
- Scenario 3: Neutral Base-Building Range — Price stabilizes after the shock and chops between support and resistance as the ADX cools. Trigger: several closes between $145 and $168 with RSI back near 40. Target: $150-$162. Invalidation: close outside $140-$172. (17% probability)
PRICE TARGETS
- Target Price: $148.00 (46-day, Dec 22, 2026)
- Expected Range: $135.00 to $162.00. Width is $27, about 17.2% of current price, consistent with the 30-60 day guidance.
- Key Levels: Support at $144.72, Resistance at $170.93
OVERALL BIAS
OVERALL BIAS: BEARISH - A fresh bearish MACD crossover, −DI dominating at ADX 31, and a gap-down break below the EMA 21, EMA 55 and SMA 50D favor continued weakness toward the $144 base. The oversold RSI and the stretch below the lower Bollinger Band make a relief bounce into the $170s likely, but that bounce is likely to be sold.
This is educational analysis and not financial advice.