TEAM 45-day bearish forecast — Nov 9, 2026
- Bias: Bearish
- Timeframe: 45 days (made Nov 9, 2026, target date Dec 24, 2026)
- Price at analysis: $150.26
- Price target: $142.00
- Expected range: $130.00 – $157.00
- Result: Pending — graded after the close on Dec 24, 2026
Get a free AI analysis of TEAM today
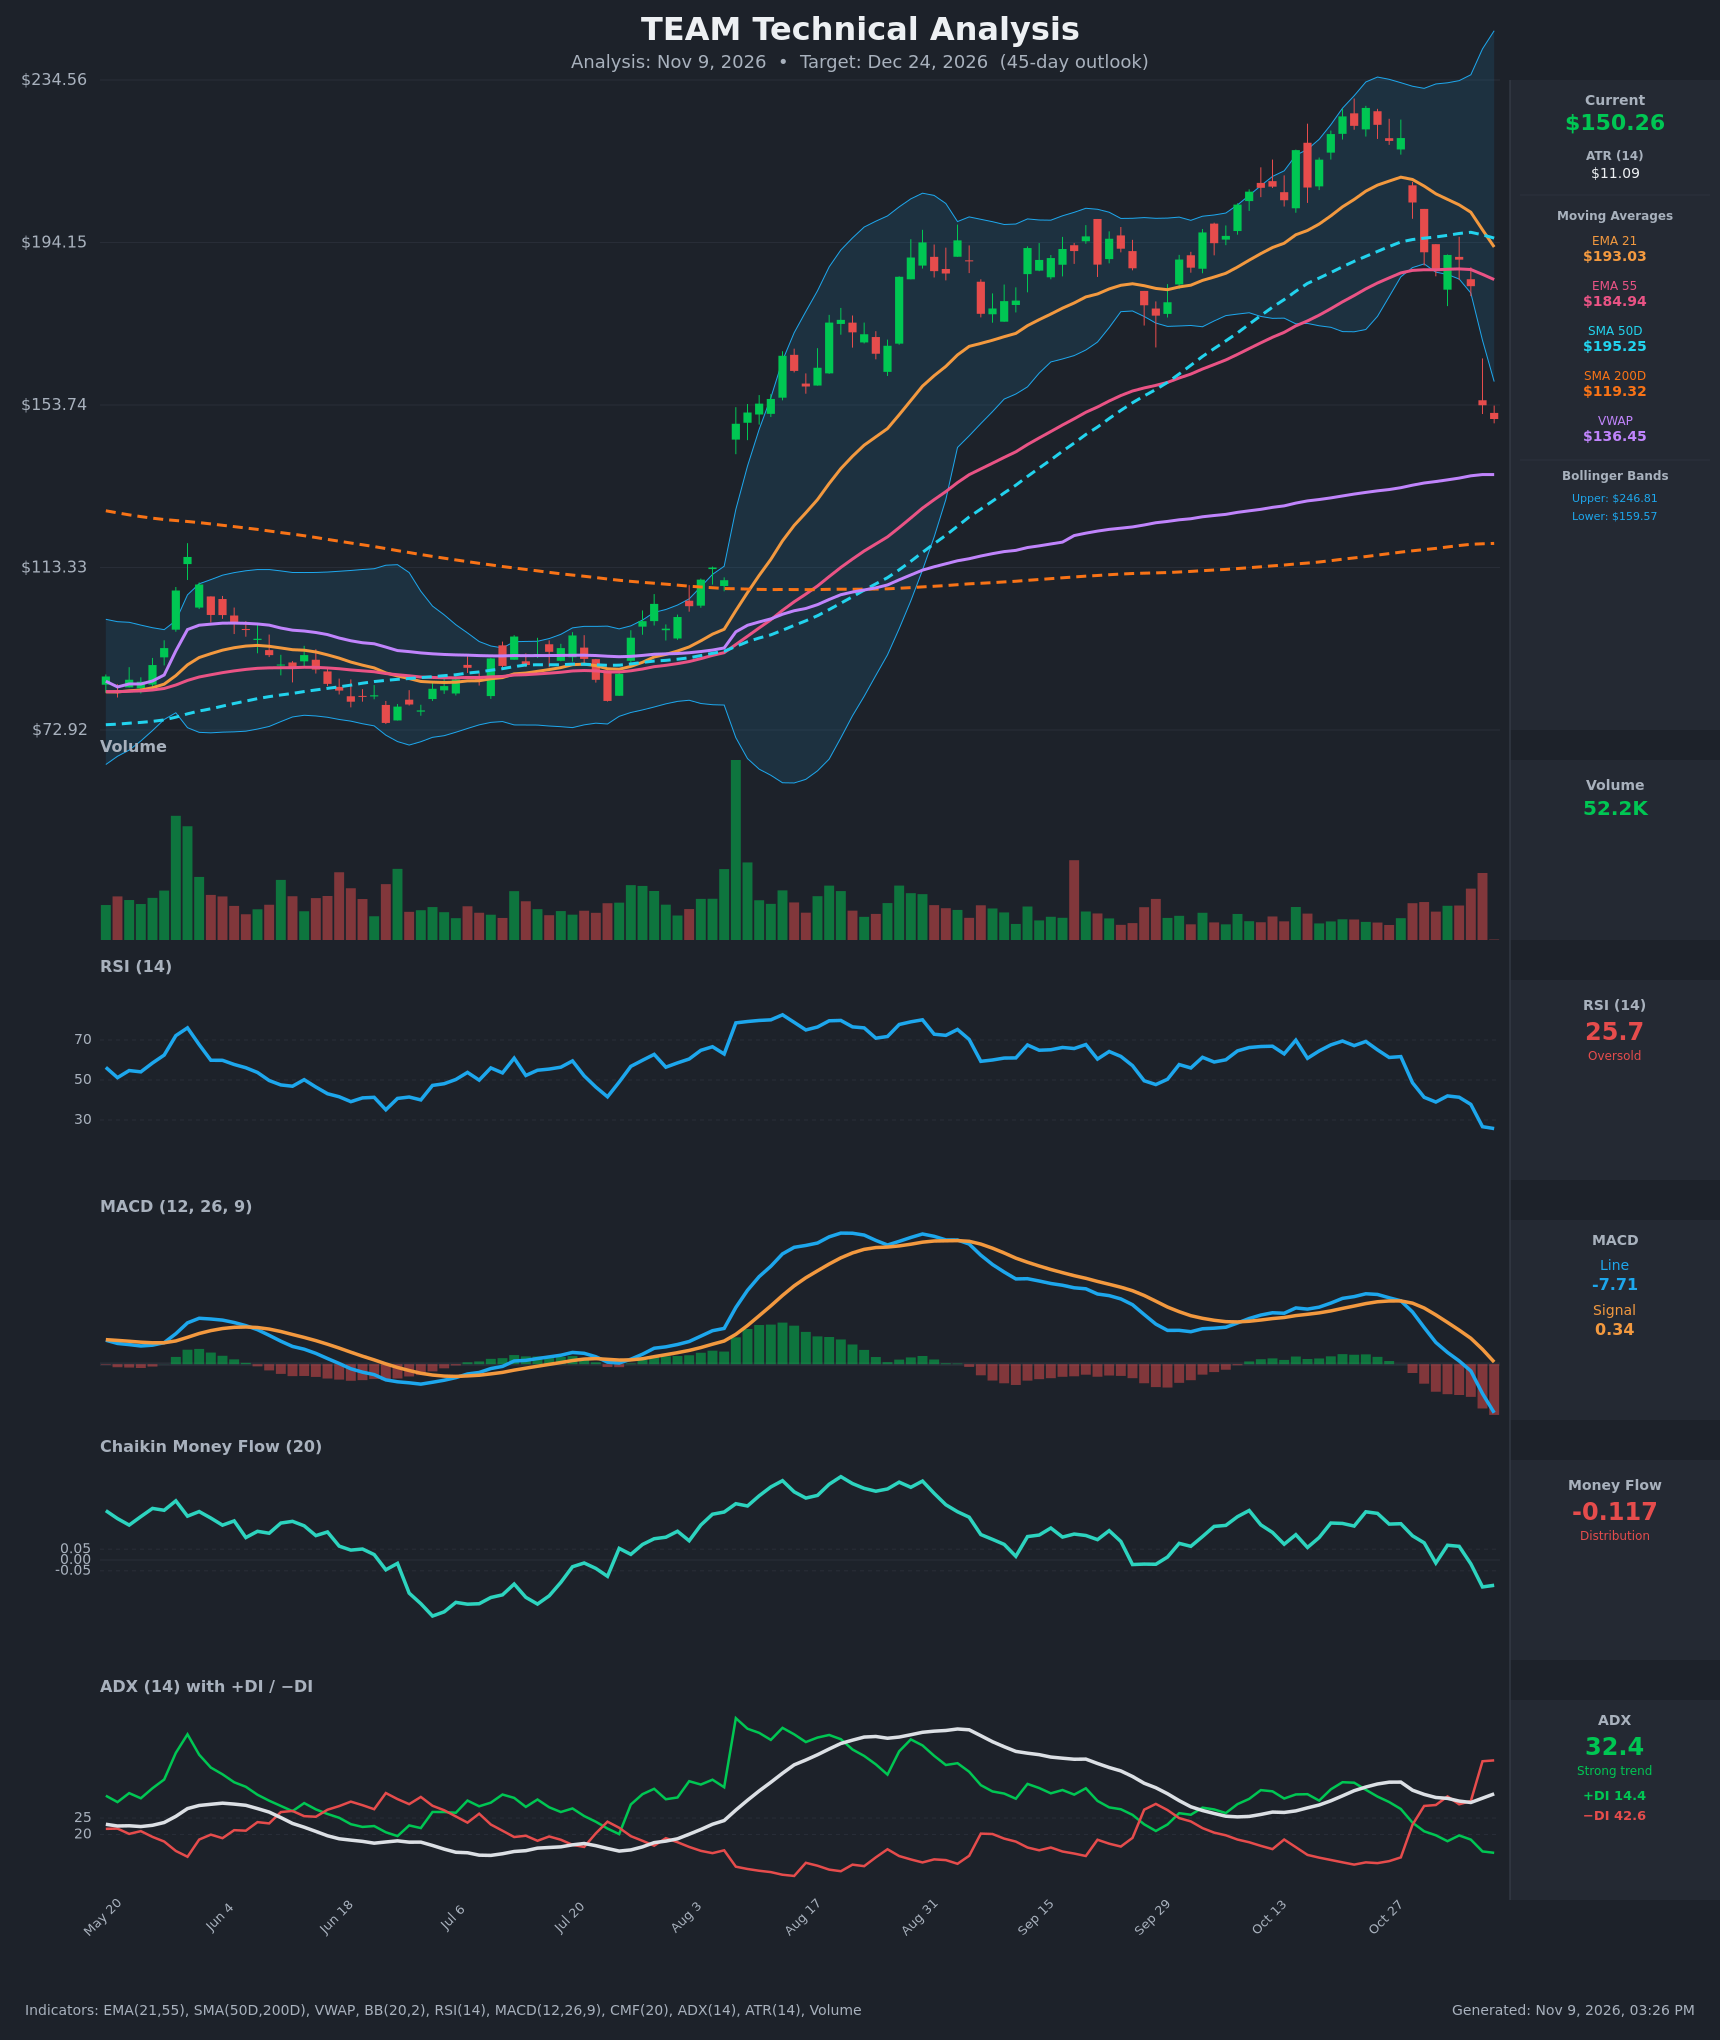
Analysis
TECHNICAL INDICATORS
- RSI (14): 25.71, oversold, and it fell from 61.7 on Oct 28 to 25.7 in 8 sessions. There is no bullish divergence yet, since RSI is still making new lows alongside price. Oversold can persist in a strong downtrend, but it also raises the odds of a relief bounce. [Bearish]
- 20 EMA: The 21 EMA is $193.03 and the 55 EMA is $184.94. Price at $150.26 is about 22% below the 21 EMA, so both act as heavy overhead resistance. The 21 EMA is falling fast and is only $8 above the 55 EMA, so a bearish 21/55 cross looks imminent. [Bearish]
- MACD: The line is -7.71 against a signal of +0.34, for a histogram of about -8.05. The bearish signal-line cross came on Oct 29, and the line crossed below zero on Nov 5. The histogram is expanding negatively, so downside momentum is still accelerating. [Bearish]
- Bollinger Bands (20): Price is $150.26 against a lower band of $159.57 and an upper band of $246.81, so it sits below the lower band. The bands are wide after the volatility expansion. A close outside the lower band shows a strong momentum break, which can mean a snap-back toward the mid-band, but in a trend it is usually a band walk. [Bearish]
- CMF (20): -0.117, below the -0.05 threshold. It has dropped from +0.22 in late October to negative territory, with the sharpest decline on the Nov 6 gap. This shows distribution and heavy selling pressure. [Distribution]
- ADX (14): 32.4 and rising, with +DI at 14.4 and −DI at 42.6. Bears are firmly in control, and the DI spread of about 28 points is very wide. This is a strong, established downtrend, not a range. [Strong Trend – Bearish]
- Volume: The reading is 52.2K, and the chart shows volume rising on the last few red candles, including the gap down. That is consistent with an earnings or news-driven repricing and institutional distribution, not routine noise. Follow-through selling on increasing volume supports the downtrend. [Bearish – Distribution]
DIVERGENCES & TRENDS
- Divergences: No bullish divergence is visible. RSI, MACD and CMF all confirm the price low, so momentum is not yet exhausted. A divergence would only appear if price makes a lower low while RSI holds above 25.
- Moving-average structure:
- The 21 EMA has turned sharply lower and is about to cross below the 55 EMA.
- The SMA50D at $195.25 is flattening and rolling over. It is still far above the SMA200D at $119.32, so there is no death cross, but the gap is narrowing.
- Price is still above the SMA200D, so the long-term uptrend is not broken. The SMA200D at $119.32 is the major long-term floor.
- VWAP: Price at $150.26 is still above VWAP at $136.45. VWAP is the next major magnet, and it sits close to the August breakout gap.
- Crossovers and breaks:
- MACD crossed below its signal on Oct 29.
- −DI crossed above +DI on Oct 29–30 and has since widened dramatically.
- Price broke below the 21 EMA, 55 EMA, SMA50D and lower Bollinger Band in a single leg.
- Momentum trend: A -16% single-day drop on Nov 6 (from $183.29 to $153.68) is a classic gap-down breakdown. It followed a rejection near $227, and the price is now at the top of the August gap zone (about $140–$153).
CHART PATTERNS
- Bearish Rising Wedge / Bearish Expanding Triangle (reversal): The Aug–Oct advance made higher highs and higher lows (about $195 → $227) with growing volatility. The Nov 6 gap down through all the moving averages looks like the downside resolution of this pattern.
- Measured target: Wedge and expanding-triangle breakdowns typically retrace to the pattern origin, which is the August breakout gap zone around $140–$153. Price is already at its upper edge. A full retracement would extend toward $120–$136, near the VWAP and SMA200D.
- Gap fill context: The August gap up from about $140 to $153 is partly being tested. Gaps often get filled, which supports a drift toward $136–$140.
- Counter-signal: There is no confirmed bullish reversal pattern (no double bottom or falling wedge). A relief rally toward $160–$175 would likely be a dead-cat bounce into the declining EMAs, not a trend reversal.
POTENTIAL SCENARIOS
- Scenario 1: Bearish Continuation Toward VWAP/Gap Fill — Post-gap distribution continues with −DI dominant and MACD still falling. Price grinds down to fill the August gap and test VWAP. Trigger: a daily close below $146 (the recent low area). Target: $136–$140 first, with an extension to $128–$130. Invalidation: a daily close above $165, which would reclaim the lower Bollinger Band and the gap. (50% probability)
- Scenario 2: Bullish Oversold Relief Bounce — RSI below 26 and price well below the lower band triggers a mean-reversion rally that stalls under the falling 55 EMA. Trigger: a reversal candle with a close above $159.57 on rising volume and a positive RSI divergence. Target: $165–$175, with the 55 EMA at about $185 as the ceiling. Invalidation: a close back below $146. (30% probability)
- Scenario 3: Neutral Basing Range — Price stabilizes after the shock and chops between the VWAP area and the lower band while ADX cools. Trigger: several sessions of narrow range with CMF returning toward zero. Target: $140–$158. Invalidation: a close outside $135–$162. (20% probability)
PRICE TARGETS
- Target Price: $142.00 (45-day, about -5.5% from current)
- Expected Range: $130.00 to $157.00 (width $27, which is 18% of the current price and fits the 30–60 day guidance of 12–18%)
- Key Levels: Support at $136.45 (VWAP, with the August gap zone and the SMA200D at $119.32 below it), Resistance at $159.57 (lower Bollinger Band, with the 55 EMA at $184.94 as the next major resistance)
OVERALL BIAS
OVERALL BIAS: BEARISH - A strong, accelerating downtrend (ADX 32.4 with −DI 42.6 against +DI 14.4), a bearish MACD cross, CMF distribution and a breakdown below every moving average point to continued weakness. RSI at 25.7 raises the chance of a bounce, but any rally likely meets heavy resistance, and a drift toward the VWAP and gap-fill zone near $142 is the favored 45-day outcome.
This is educational analysis and not financial advice.