LEU 4-day bullish forecast — Nov 9, 2026
- Bias: Bullish
- Timeframe: 4 days (made Nov 9, 2026, target date Nov 13, 2026)
- Price at analysis: $117.48
- Price target: $119.80
- Expected range: $114.50 – $121.50
- Result: Incorrect (-13.6%) — closed at $101.56 on Nov 13, 2026; quality score 0/100
Get a free AI analysis of LEU today
Analysis
TECHNICAL INDICATORS
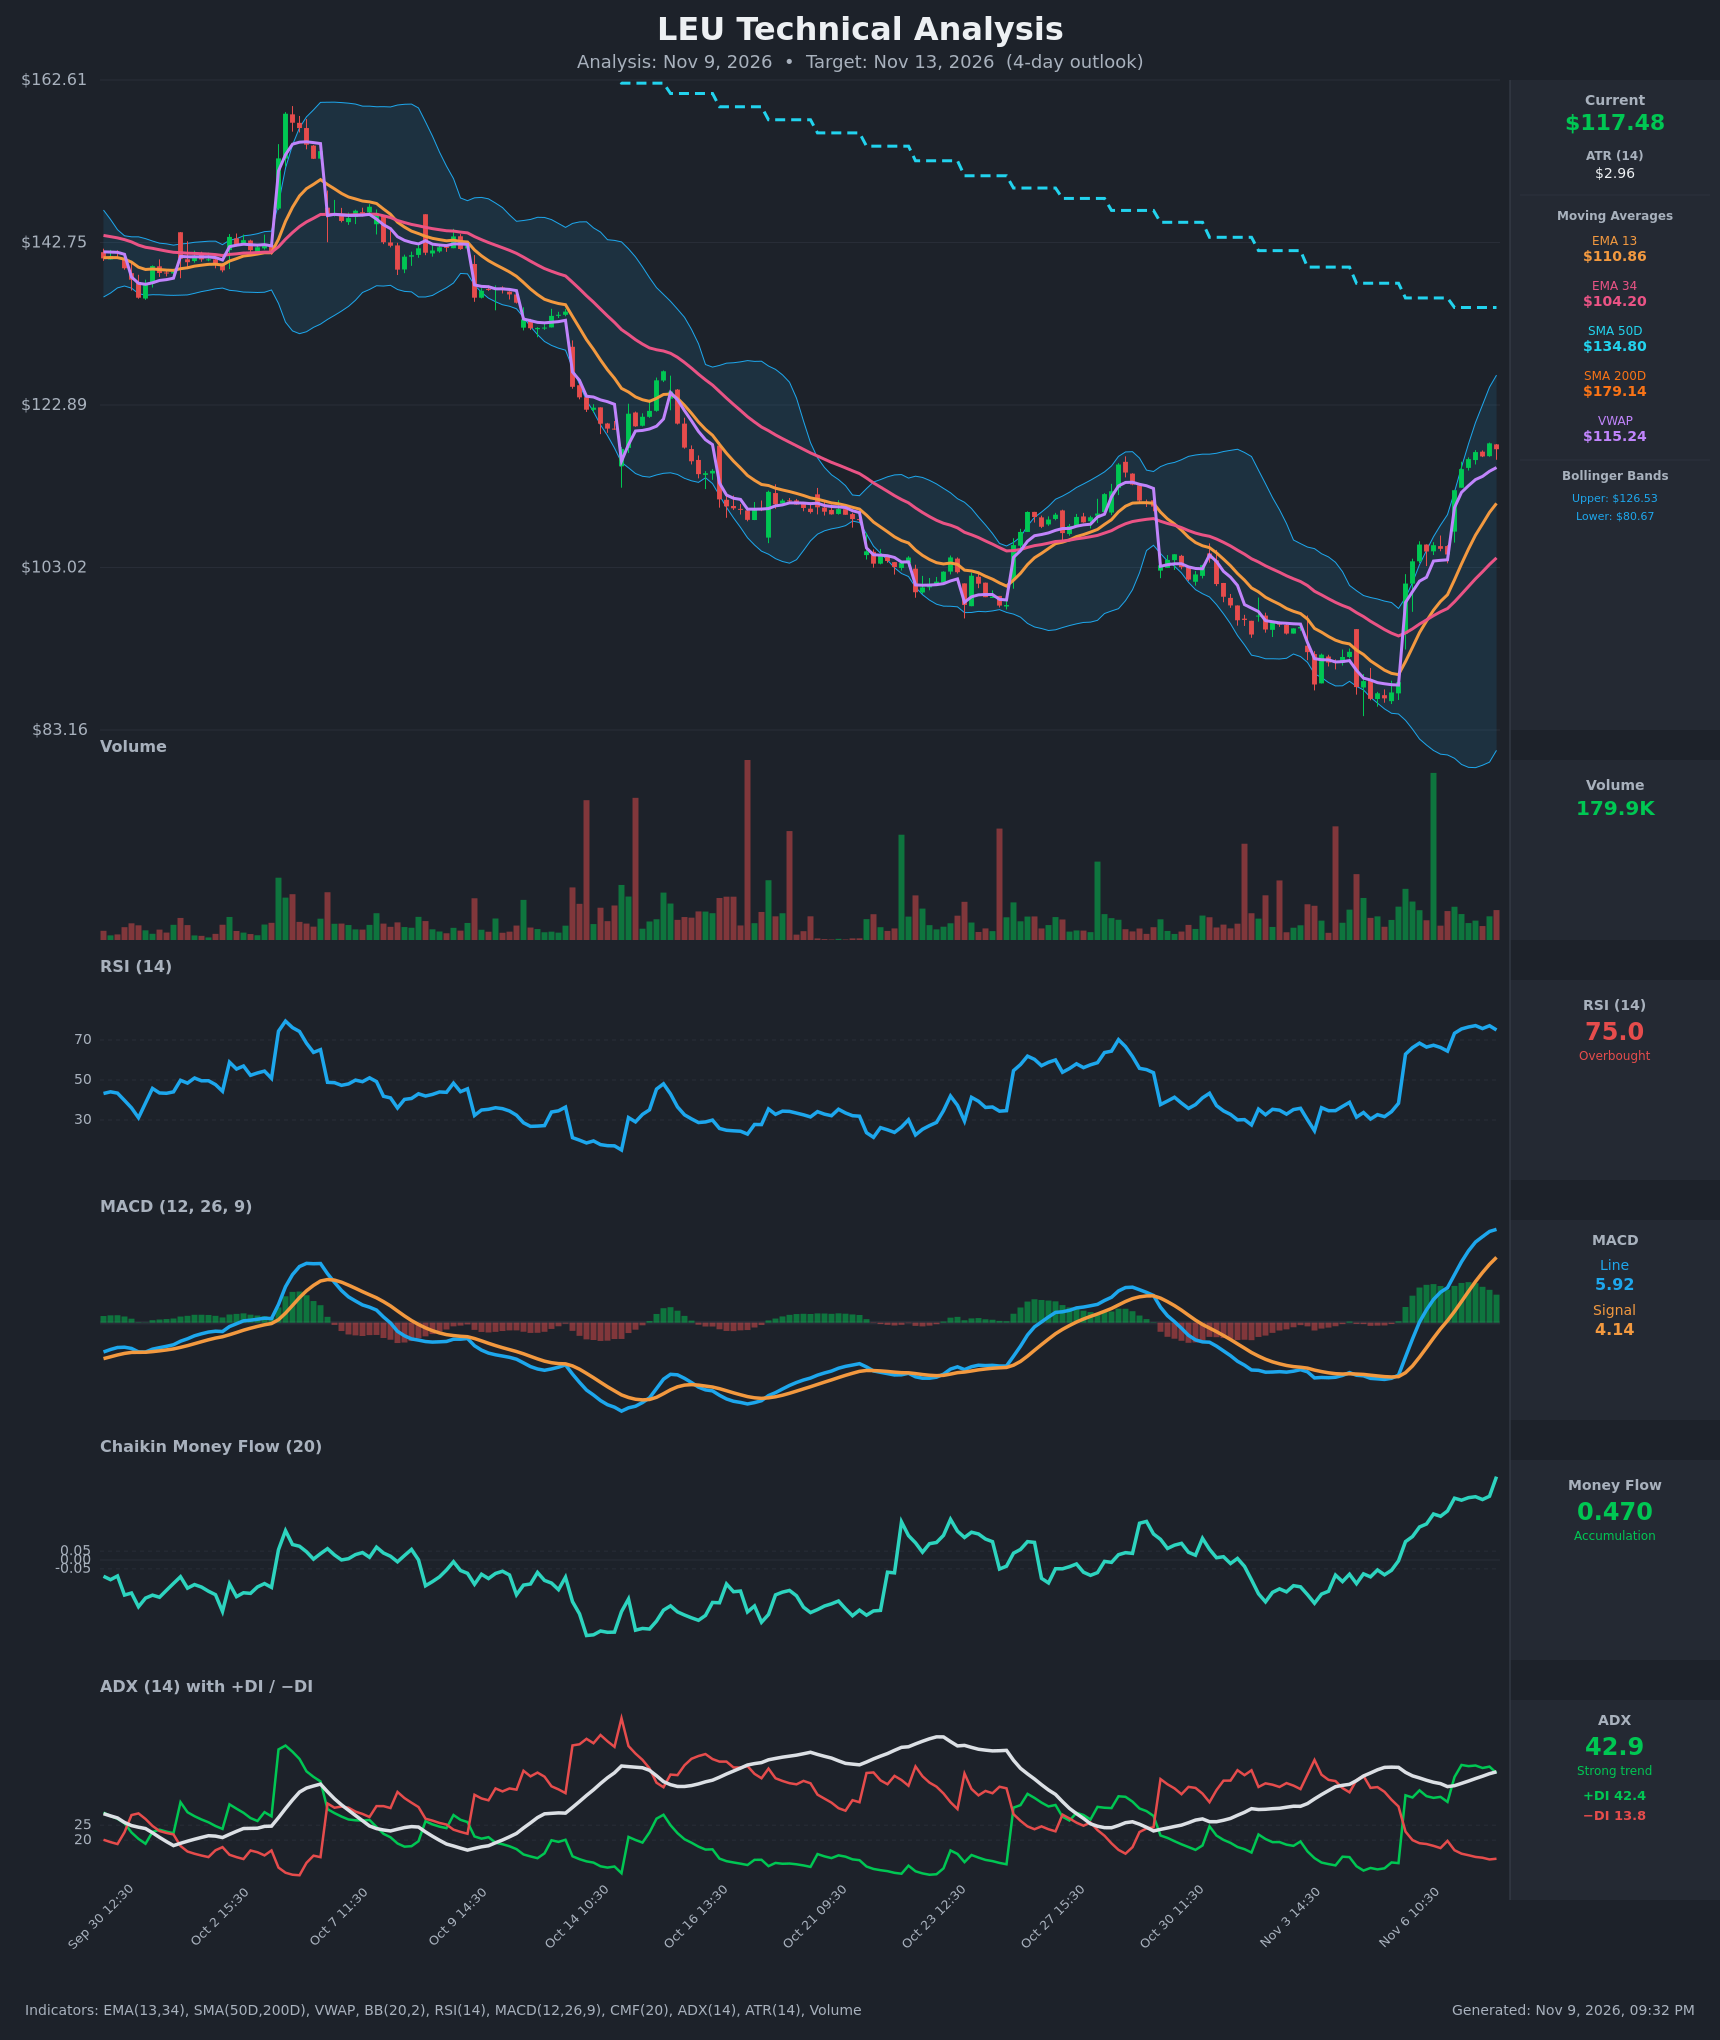
- RSI (14): 75.01, in overbought territory and down slightly from the 77.2 peak. It has held above 70 for most of the last 8 bars, which is typical of a strong impulsive trend, but upside momentum is no longer accelerating. [Neutral]
- 20 EMA: The chart shows EMA 13 ($110.86) and EMA 34 ($104.20). Price at $117.48 is above both, and EMA 13 crossed above EMA 34 around Nov 6 13:30. The spread is widening, so both act as dynamic support. [Bullish]
- MACD: Line 5.92 is above Signal 4.14, with a positive histogram of about +1.78. The histogram peaked near +2.28 and has shrunk for two bars, so momentum is still positive but cooling. [Bullish]
- Bollinger Bands (20): Upper $126.53, lower $80.67. The bands are very wide after the volatile selloff. Price sits in the upper half, about $9 below the upper band, so it is extended but not at the band. The bands are still expanding upward. [Bullish]
- CMF (20): 0.470, well above +0.05 and rising to a new high. This is strong accumulation and confirms the rally with buying pressure. [Accumulation]
- ADX (14): 42.9 and rising, with +DI at 42.4 far above −DI at 13.8. The −DI/+DI crossover happened on Nov 6 and the gap has widened since. A strong uptrend is in place. [Strong Trend + Bullish]
- Volume: 179.9K on the latest bar, which is modest and well below the large spike on Nov 6. The advance is not being driven by a fresh volume surge, so continued buying participation is needed. [Neutral to mildly Bullish]
DIVERGENCES & TRENDS
- Momentum divergence (mild): Price is near its highs while the MACD histogram has shrunk for two bars and RSI has slipped from 77.2 to 75.0. This is early momentum fatigue, not a confirmed bearish divergence.
- Crossovers:
- EMA 13 crossed above EMA 34 on Nov 6.
- MACD is above its signal line.
- +DI is above −DI.
- Price has reclaimed VWAP ($115.24) and holds above it.
- Long-term trend is still bearish: SMA 50 ($134.80) is below SMA 200 ($179.14), a death cross, and price is about 34% below the SMA 200. This is a counter-trend rally from the $89 low, with SMA 50 at $134.80 as a major overhead target and resistance.
- Trend of indicators: CMF and ADX are at or near highs, which supports trend persistence. RSI is overbought, which raises the odds of a pause or shallow pullback.
CHART PATTERNS
- Bullish Falling Wedge / V-shaped reversal: The multi-week decline from about $160 to $89 shows a series of lower highs and lower lows. The sharp breakout from about $89 to $118 resembles a falling-wedge resolution. The measured target is a retrace toward the wedge's origin, so the $126–$135 zone (upper Bollinger Band and SMA 50) is the longer-term objective.
- Bullish Flag / Pennant (possible, developing): The last few bars show tight consolidation between $116 and $118 after the vertical advance. If this holds, a continuation breakout above $118.20 targets roughly $125–$127. A break below VWAP would invalidate it.
- No confirmed top pattern, such as a double top or head and shoulders, is visible yet.
POTENTIAL SCENARIOS
- Scenario 1: Bullish Flag Continuation — Price consolidates above VWAP and the EMA 13, then breaks the recent high as ADX and CMF stay strong. Trigger: hourly close above $118.20 on rising volume. Target: $121.50–$124.00, with $126.53 (upper Bollinger Band) as an extension. Invalidation: close below $114.50. (50% probability)
- Scenario 2: Bearish Overbought Pullback — RSI above 70 and a fading MACD histogram prompt profit-taking, with a retest of VWAP and the EMA 13. Trigger: hourly close below $115.24 (VWAP). Target: $110.90–$112.00 (EMA 13 zone). Invalidation: reclaim of $118.20. (32% probability)
- Scenario 3: Neutral Tight Consolidation — Price chops between $115 and $119 while the indicators cool without a decisive break. Trigger: low volume and RSI drifting toward 60–65. Target: $116–$118. Invalidation: break of either range edge on volume. (18% probability)
PRICE TARGETS
- Target Price: $119.80 (4-day horizon, about +2% from $117.48)
- Expected Range: $114.50 to $121.50. The width is $7.00, about 6.0% of the current price, which fits a 4-day horizon: wider than a 2–3 day range and narrower than a 7–10 day range.
- Key Levels: Support at $115.24 (VWAP, then the $110.86 EMA 13), Resistance at $118.20 (recent swing high, then the $126.53 upper Bollinger Band and the $134.80 SMA 50)
OVERALL BIAS
OVERALL BIAS: BULLISH - ADX of 42.9 with +DI far above −DI, a positive MACD, CMF of 0.47 and price above VWAP and both EMAs point to continued upside. The overbought RSI and fading MACD histogram argue for a modest target and a possible shallow pullback toward VWAP along the way.
This is educational analysis and not financial advice.