LEU 52-day bullish forecast — Nov 9, 2026
- Bias: Bullish
- Timeframe: 52 days (made Nov 9, 2026, target date Dec 31, 2026)
- Price at analysis: $117.48
- Price target: $126.00
- Expected range: $107.00 – $128.00
- Result: Pending — graded after the close on Dec 31, 2026
Get a free AI analysis of LEU today
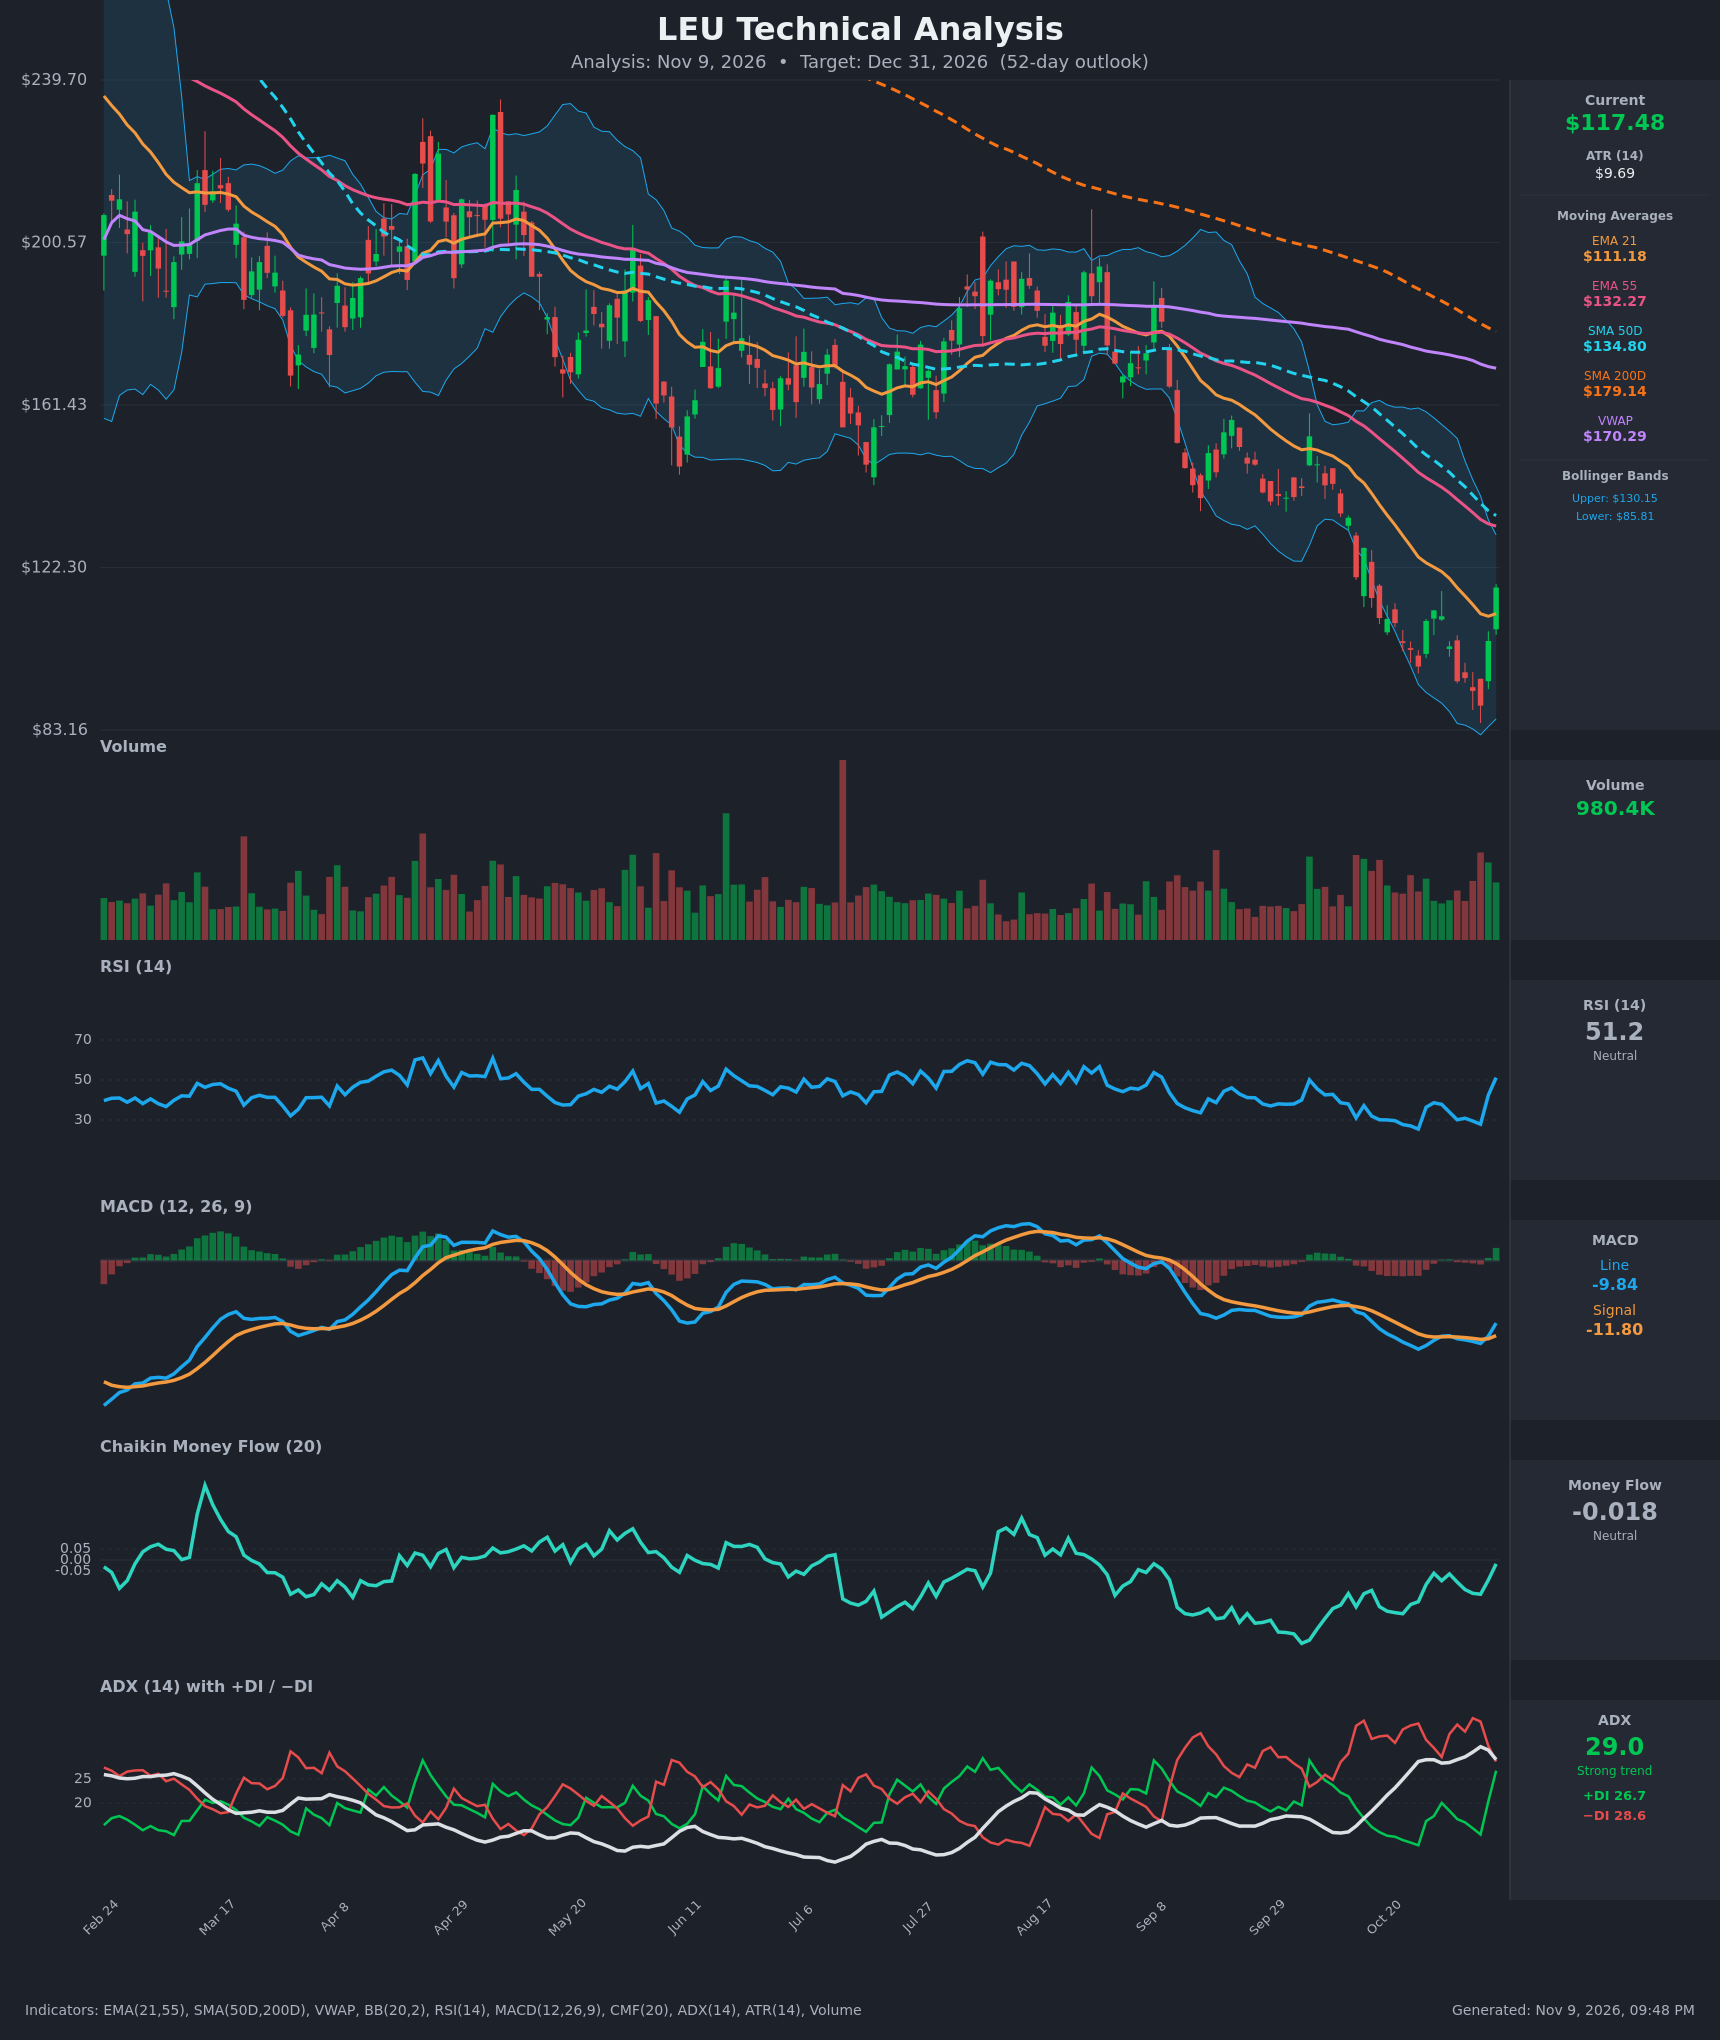
Analysis
TECHNICAL INDICATORS
- RSI (14): 51.18, up sharply from 27.9 on Nov 5 and 30.0 on Oct 20. Momentum has swung from oversold to neutral in two sessions and is now testing the 50 midline. [Bullish]
- 20 EMA: The supplied 21-period EMA is $111.18 and price ($117.48) is back above it after closing below it from Oct 20 to Nov 5. The EMA is flattening, so it is now the first support. EMA55 ($132.27) is still falling and sits well above price. [Bullish]
- MACD: The line (-9.84) is rising toward the signal (-11.80) and its gap has narrowed from -2.45 on Oct 20 to about +1.96 on Nov 9. The histogram has flipped slightly positive, meaning the line is now above the signal. Both lines are still deep below zero, so this is a bottoming-momentum signal rather than a trend change. [Bullish]
- Bollinger Bands (20): The bands are $85.81 lower and $130.15 upper, with the mid-band around $108. Price rode the lower band down to $89 on Nov 5 and snapped back above the mid-band. The bands are wide (about 38% of price) and the upper band is the next volatility target. [Bullish]
- CMF (20): -0.018, which is neutral. It has climbed from -0.243 on Oct 22 and is near zero. Selling pressure has faded but there is no accumulation yet. [Neutral]
- ADX (14): 29.0 with -DI (28.6) barely above +DI (26.7). ADX is strong but now rolling over from 31.7. +DI has doubled from 13.5 in four sessions, so the bearish trend is losing dominance and a bullish DI crossover is imminent. [Strong Trend, fading bearish, DI crossover near]
- Volume: 980.4K on the Nov 9 green candle, among the heavier recent bars. A +12% advance on above-average volume suggests real buying and short covering, but it is only two sessions of evidence. [Bullish, needs follow-through]
DIVERGENCES & TRENDS
- Price made a new low on Nov 5 ($89.03). RSI (27.9) and MACD (-13.0) were weaker than at the Oct 26 low, so there is no clean bullish divergence. The reversal is momentum-driven, not divergence-driven.
- The EMA21 has now been reclaimed. EMA21 ($111.18) is below EMA55 ($132.27), SMA50D ($134.80) is below SMA200D ($179.14), and price is far below VWAP ($170.29). The death-cross structure is intact and the long-term trend is still down.
- MACD has crossed above its signal line (Nov 6 to Nov 9), but below zero.
- CMF has recovered from -0.24 to near zero, and the DI spread has narrowed from 21 points (-DI lead) to under 2.
- Overhead resistance is stacked at EMA55 ($132.27), SMA50D ($134.80) and the upper Bollinger Band ($130.15). The two-day +32% jump is extended and may need a retest of the $104-$111 area.
CHART PATTERNS
- Bullish Falling Wedge / descending channel: Since September, price has made lower highs and lower lows inside a falling channel. The lower band tag at $89 followed by a sharp breakout looks like a wedge-breakout attempt. The measured move toward the top of the structure is $130-$135, which coincides with EMA55 and SMA50D.
- Bearish Flag risk: If the bounce stalls under $132-$135 and fails, the move would be a bear-flag-style relief rally inside a larger downtrend. A break below $104 would target $89-$95 and then lower.
- There is no valid double bottom. The Nov 3 low (about $95) and the Nov 5 low ($89) are not equal, and the neckline is untested.
POTENTIAL SCENARIOS
- Scenario 1: Bullish Reversal Extension — The wedge breakout holds, price retests EMA21 and then grinds up into the moving-average cluster. MACD crosses toward zero and +DI takes over from -DI. Trigger: daily close above $122-$123 with expanding volume. Target: $128-$135 (BB upper, EMA55, SMA50D). Invalidation: daily close below $104. (45% probability)
- Scenario 2: Bearish Failed Relief Rally — The two-day spike is exhausted and sellers defend the falling EMA55/SMA50D zone. Price rolls over inside the downtrend, with the SMA200D death-cross structure as overhead weight. Trigger: rejection near $125-$132 and a close below the EMA21 ($111). Target: $95-$100, a retest of the Nov lows. Invalidation: close above $135. (35% probability)
- Scenario 3: Neutral Range Consolidation — Price digests the spike between EMA21 support and the upper-band resistance, with ADX fading below 25. Trigger: repeated closes between $108 and $128. Target: $112-$124. Invalidation: a close outside $104-$132. (20% probability)
PRICE TARGETS
- Target Price: $126.00 (52-day horizon, about Dec 31)
- Expected Range: $107.00 to $128.00 (width $21, about 17.9% of current price)
- Key Levels: Support at $111.18 (EMA21; secondary at $104.00), Resistance at $132.27 (EMA55; $134.80 SMA50D above)
OVERALL BIAS
OVERALL BIAS: BULLISH - RSI has recovered to 50 from oversold, MACD has crossed above its signal line, price has reclaimed the EMA21, and +DI is closing on -DI after a lower-band reversal on heavy volume. The long-term downtrend and overhead resistance at $132-$135 cap the upside, so conviction is modest.
This is educational analysis and not financial advice.