DDOG 48-day bearish forecast — Nov 10, 2026
- Bias: Bearish
- Timeframe: 48 days (made Nov 10, 2026, target date Dec 28, 2026)
- Price at analysis: $177.84
- Price target: $171.00
- Expected range: $156.00 – $186.00
- Result: Pending — graded after the close on Dec 28, 2026
Get a free AI analysis of DDOG today
Analysis
TECHNICAL INDICATORS
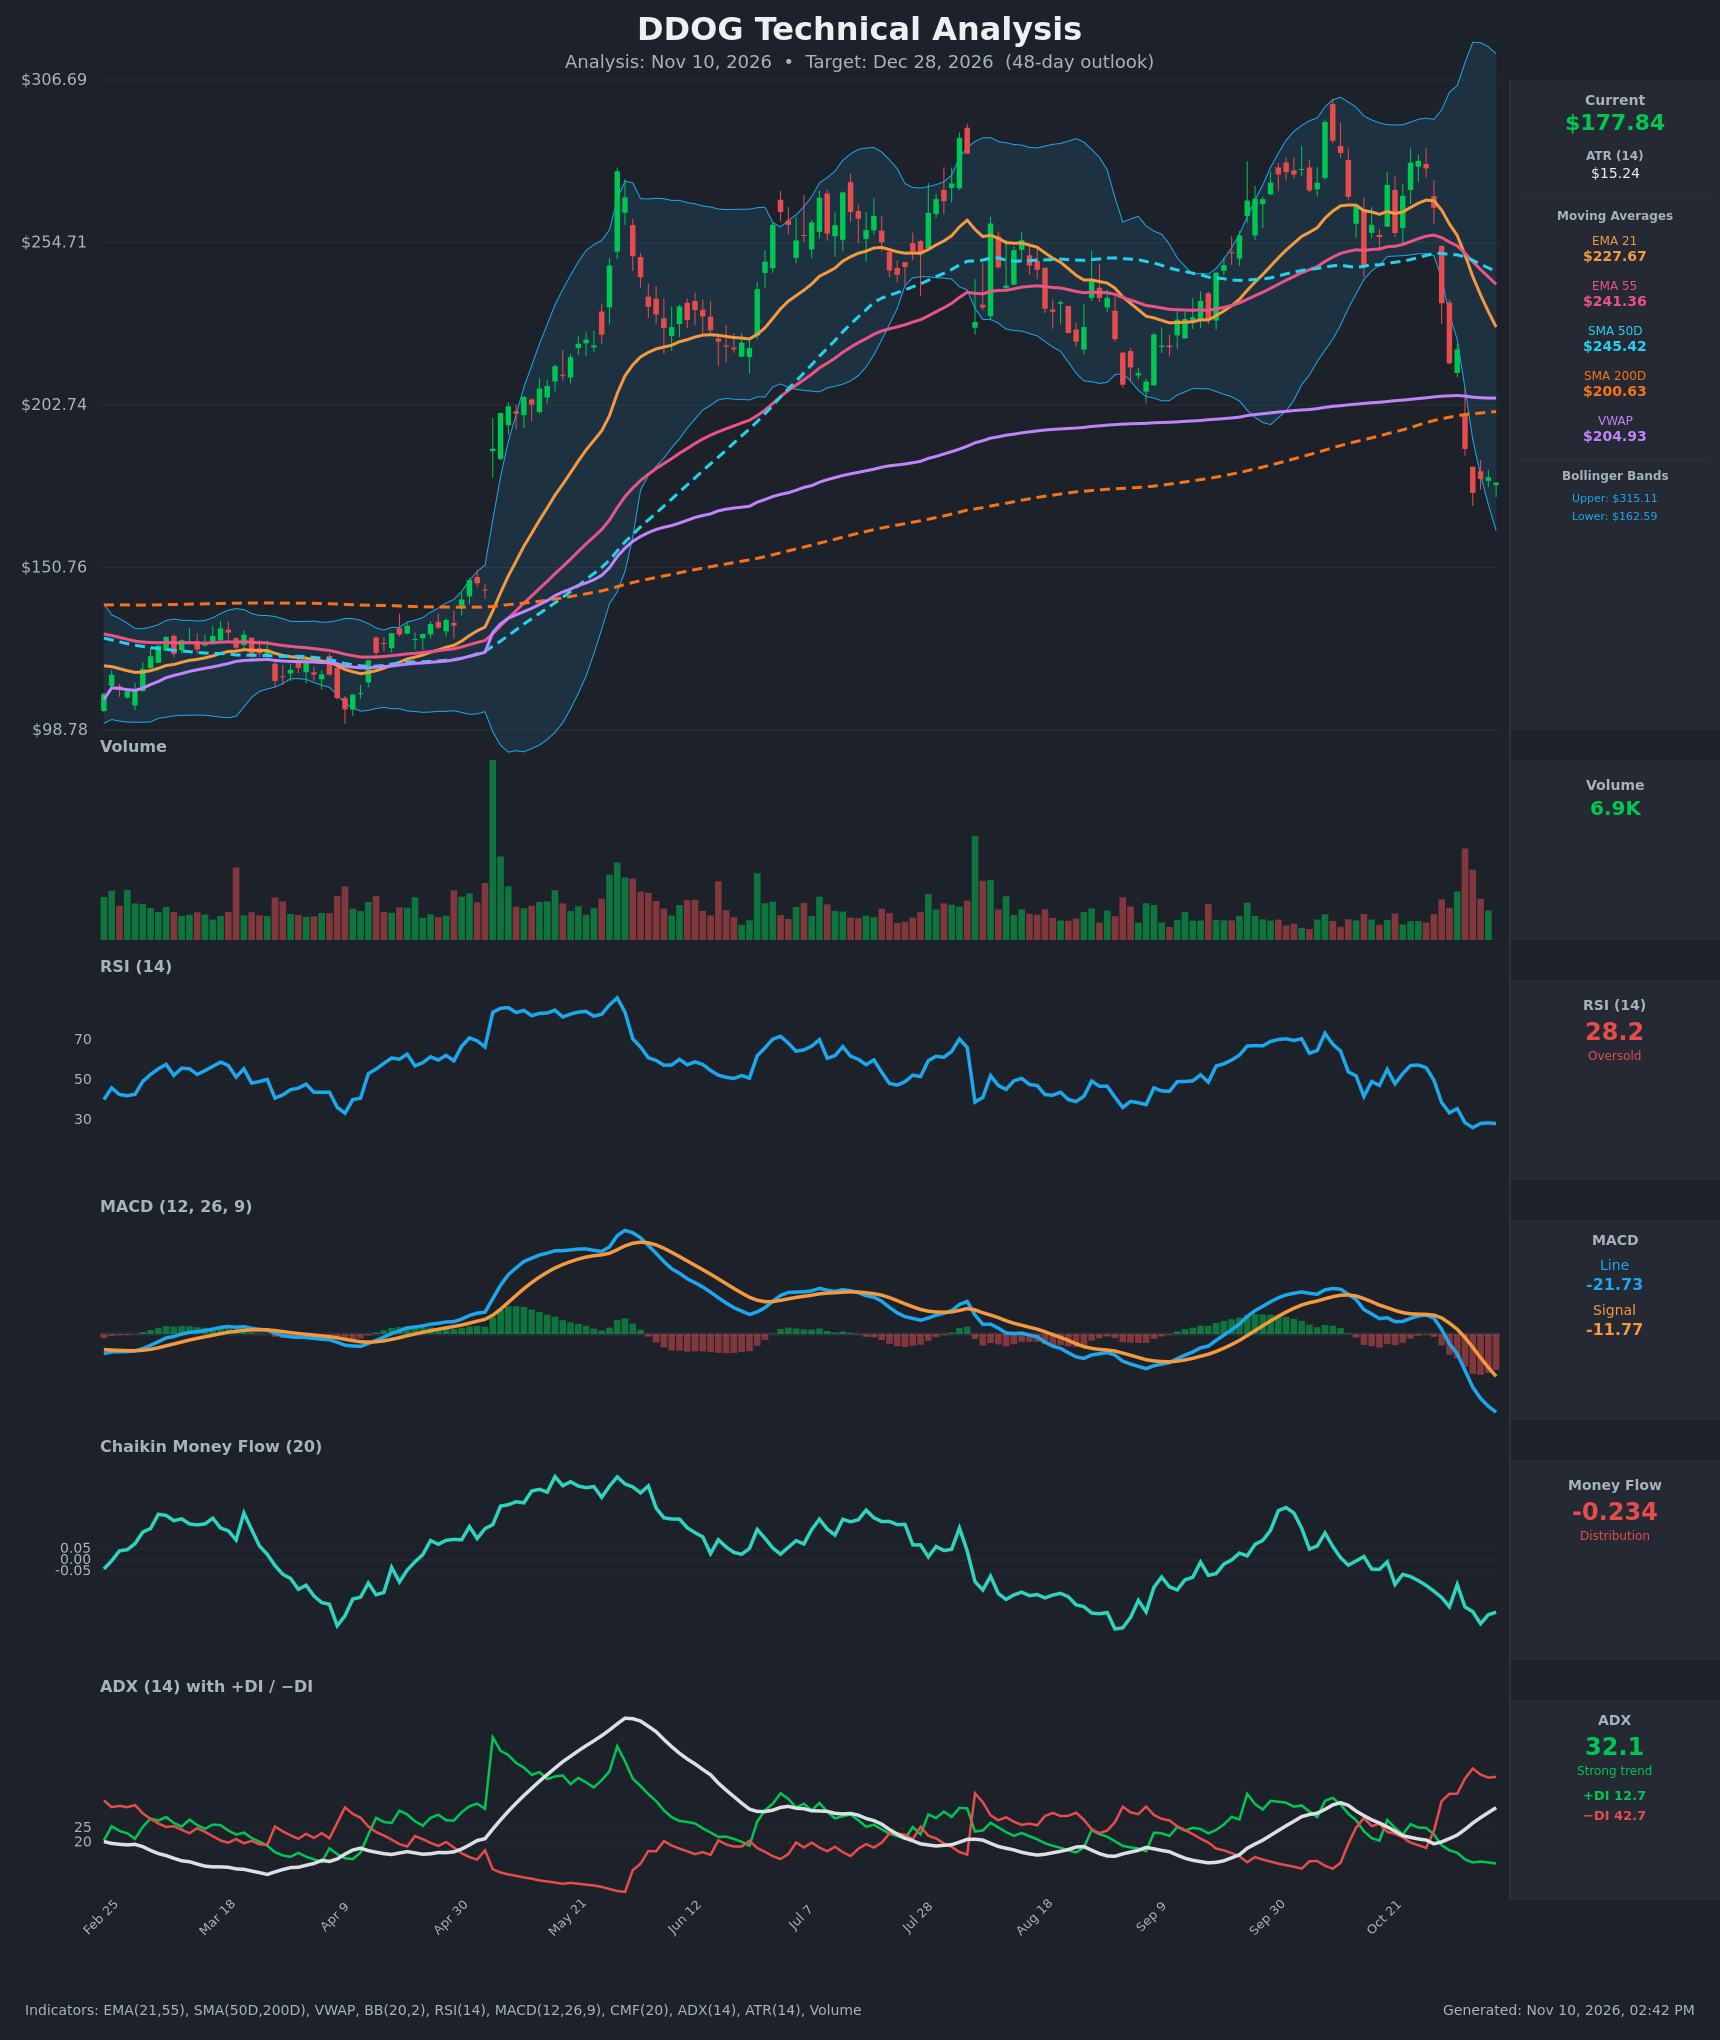
- RSI (14): 28.20, in oversold territory and flat in the 26-29 zone for the last four sessions. It fell from 57 on Oct 27, so momentum is clearly negative. The flat reading shows selling pressure is no longer accelerating, but there is no bullish divergence yet. [Bearish]
- 20 EMA: The chart uses EMA 21 at $227.67, and price at $177.84 is about 22% below it. The EMA is falling steeply and has crossed below EMA 55 ($241.36) and SMA50D ($245.42). It now acts as heavy overhead resistance. [Bearish]
- MACD: Line at -21.73 vs. signal at -11.77. The bearish crossover happened around Nov 4, and the negative histogram (about -10) is still widening. Momentum is still accelerating down. [Bearish]
- Bollinger Bands (20): Upper $315.11 and lower $162.59, with the midline around $239. The bands are very wide after the earlier volatility, and price is in the lower third, about $15 (one ATR) above the lower band. A close below the band would confirm a walk-the-band downtrend. A bounce would likely stall near the midline. [Bearish]
- CMF (20): -0.234, well below -0.05. It has been negative for weeks and is near its lows, which shows sustained distribution. [Distribution]
- ADX (14): 32.1 and rising (from 20 on Oct 29), so this is a strong trend. −DI at 42.7 is far above +DI at 12.7, so the bears are firmly in control. [Strong Trend – Bearish]
- Volume: Volume expanded on the Nov 4-5 gap-down candles (the largest bars in months), confirming institutional selling. The last few bars show smaller volume with small-bodied candles, which hints at early selling exhaustion but no capitulation reversal. Latest reading is 6.9K. [Bearish with early exhaustion]
DIVERGENCES & TRENDS
- There is no bullish RSI or MACD divergence. Both made new lows with price, so the trend is confirmed rather than diverging.
- RSI has flattened near 28 while price stabilized at $175-$180 over the last four bars. This is a tentative sign of a pause, not a reversal.
- Death-cross dynamics: EMA21 < EMA55 < SMA50D now, with EMA21 (227.67) heading toward SMA200D (200.63). SMA50D (245.42) is still above SMA200D, so there is no full death cross yet, but it is likely within weeks if price stays down.
- Price closed below SMA200D ($200.63) and VWAP ($204.93) on Nov 4. Both are now resistance, and the long-term trend support has failed.
- The bearish MACD crossover (Nov 4), the −DI crossover (Oct 29) and the CMF drop from -0.06 to -0.23 all line up with a trend change from up to down.
- The ~35% drop in about 3 weeks is extended. That raises the odds of a relief bounce, but the trend indicators favor selling into rallies.
CHART PATTERNS
- Bearish Double Top (approximate): Price peaked near the Oct 1 high (~$295) and made a slightly lower high in late Oct (~$281). The break below the ~$235-$215 neckline, accelerated by the gap down, matches the double-top reversal template. The measured move would reach well below the current price, but much of it has already been realized.
- There is no clean bullish reversal pattern (no double bottom or falling wedge) yet. The tight base at $175-$180 could become one, but it would need more time and volume confirmation.
- The earlier May-Sep range ($215-$280) acted as a distribution area, and the breakdown below it is a bearish continuation signal. Rallies back toward $200-$205 (SMA200D/VWAP) are likely to be sold.
POTENTIAL SCENARIOS
- Scenario 1: Bearish Trend Continuation — The downtrend persists, with weak bounces rejected at the SMA200/VWAP zone. The lower Bollinger Band and the base near $162 get tested. Trigger: a daily close below $172 and a new low in MACD. Target: $160-$170 by the end of the window. Invalidation: a daily close above $200 with volume. (45% probability)
- Scenario 2: Bullish Oversold Relief Rally — RSI under 30 and a ~35% decline trigger a mean-reversion bounce, which fades at SMA200D/VWAP, with price recovering toward the Nov 4 gap area. Trigger: a close above $190 with improving CMF. Target: $195-$205. Invalidation: a break below $162.59 (lower BB). (38% probability)
- Scenario 3: Neutral Basing Range — Price chops between roughly $165 and $190 while indicators reset from oversold. Trigger: low-volume consolidation with ADX falling below 25. Target: about $175-$180. Invalidation: a close outside $160-$195. (17% probability)
PRICE TARGETS
For a 48-day horizon the range width should be ~12-18% of the current price.
- Target Price: $171.00
- Expected Range: $156.00 to $186.00 (width $30.00, about 16.9% of the current price)
- Key Levels: Support at $162.59 (lower Bollinger Band), Resistance at $188.72 (Nov 4 close and gap area)
OVERALL BIAS
OVERALL BIAS: BEARISH - Price is below all major moving averages including SMA200D. MACD is bearish and widening, −DI (42.7) dominates +DI (12.7) with ADX at 32, and CMF at -0.23 shows heavy distribution. The oversold RSI (28) makes a relief bounce likely, but the evidence favors rallies failing below $200 and a modest net decline over 48 days.
This is educational analysis and not financial advice.