DDOG 44-day bearish forecast — Nov 17, 2026
- Bias: Bearish
- Timeframe: 44 days (made Nov 17, 2026, target date Dec 31, 2026)
- Price at analysis: $168.84
- Price target: $152.00
- Expected range: $90.00 – $270.00
- Result: Pending — graded after the close on Dec 31, 2026
Get a free AI analysis of DDOG today
Analysis
TECHNICAL INDICATORS
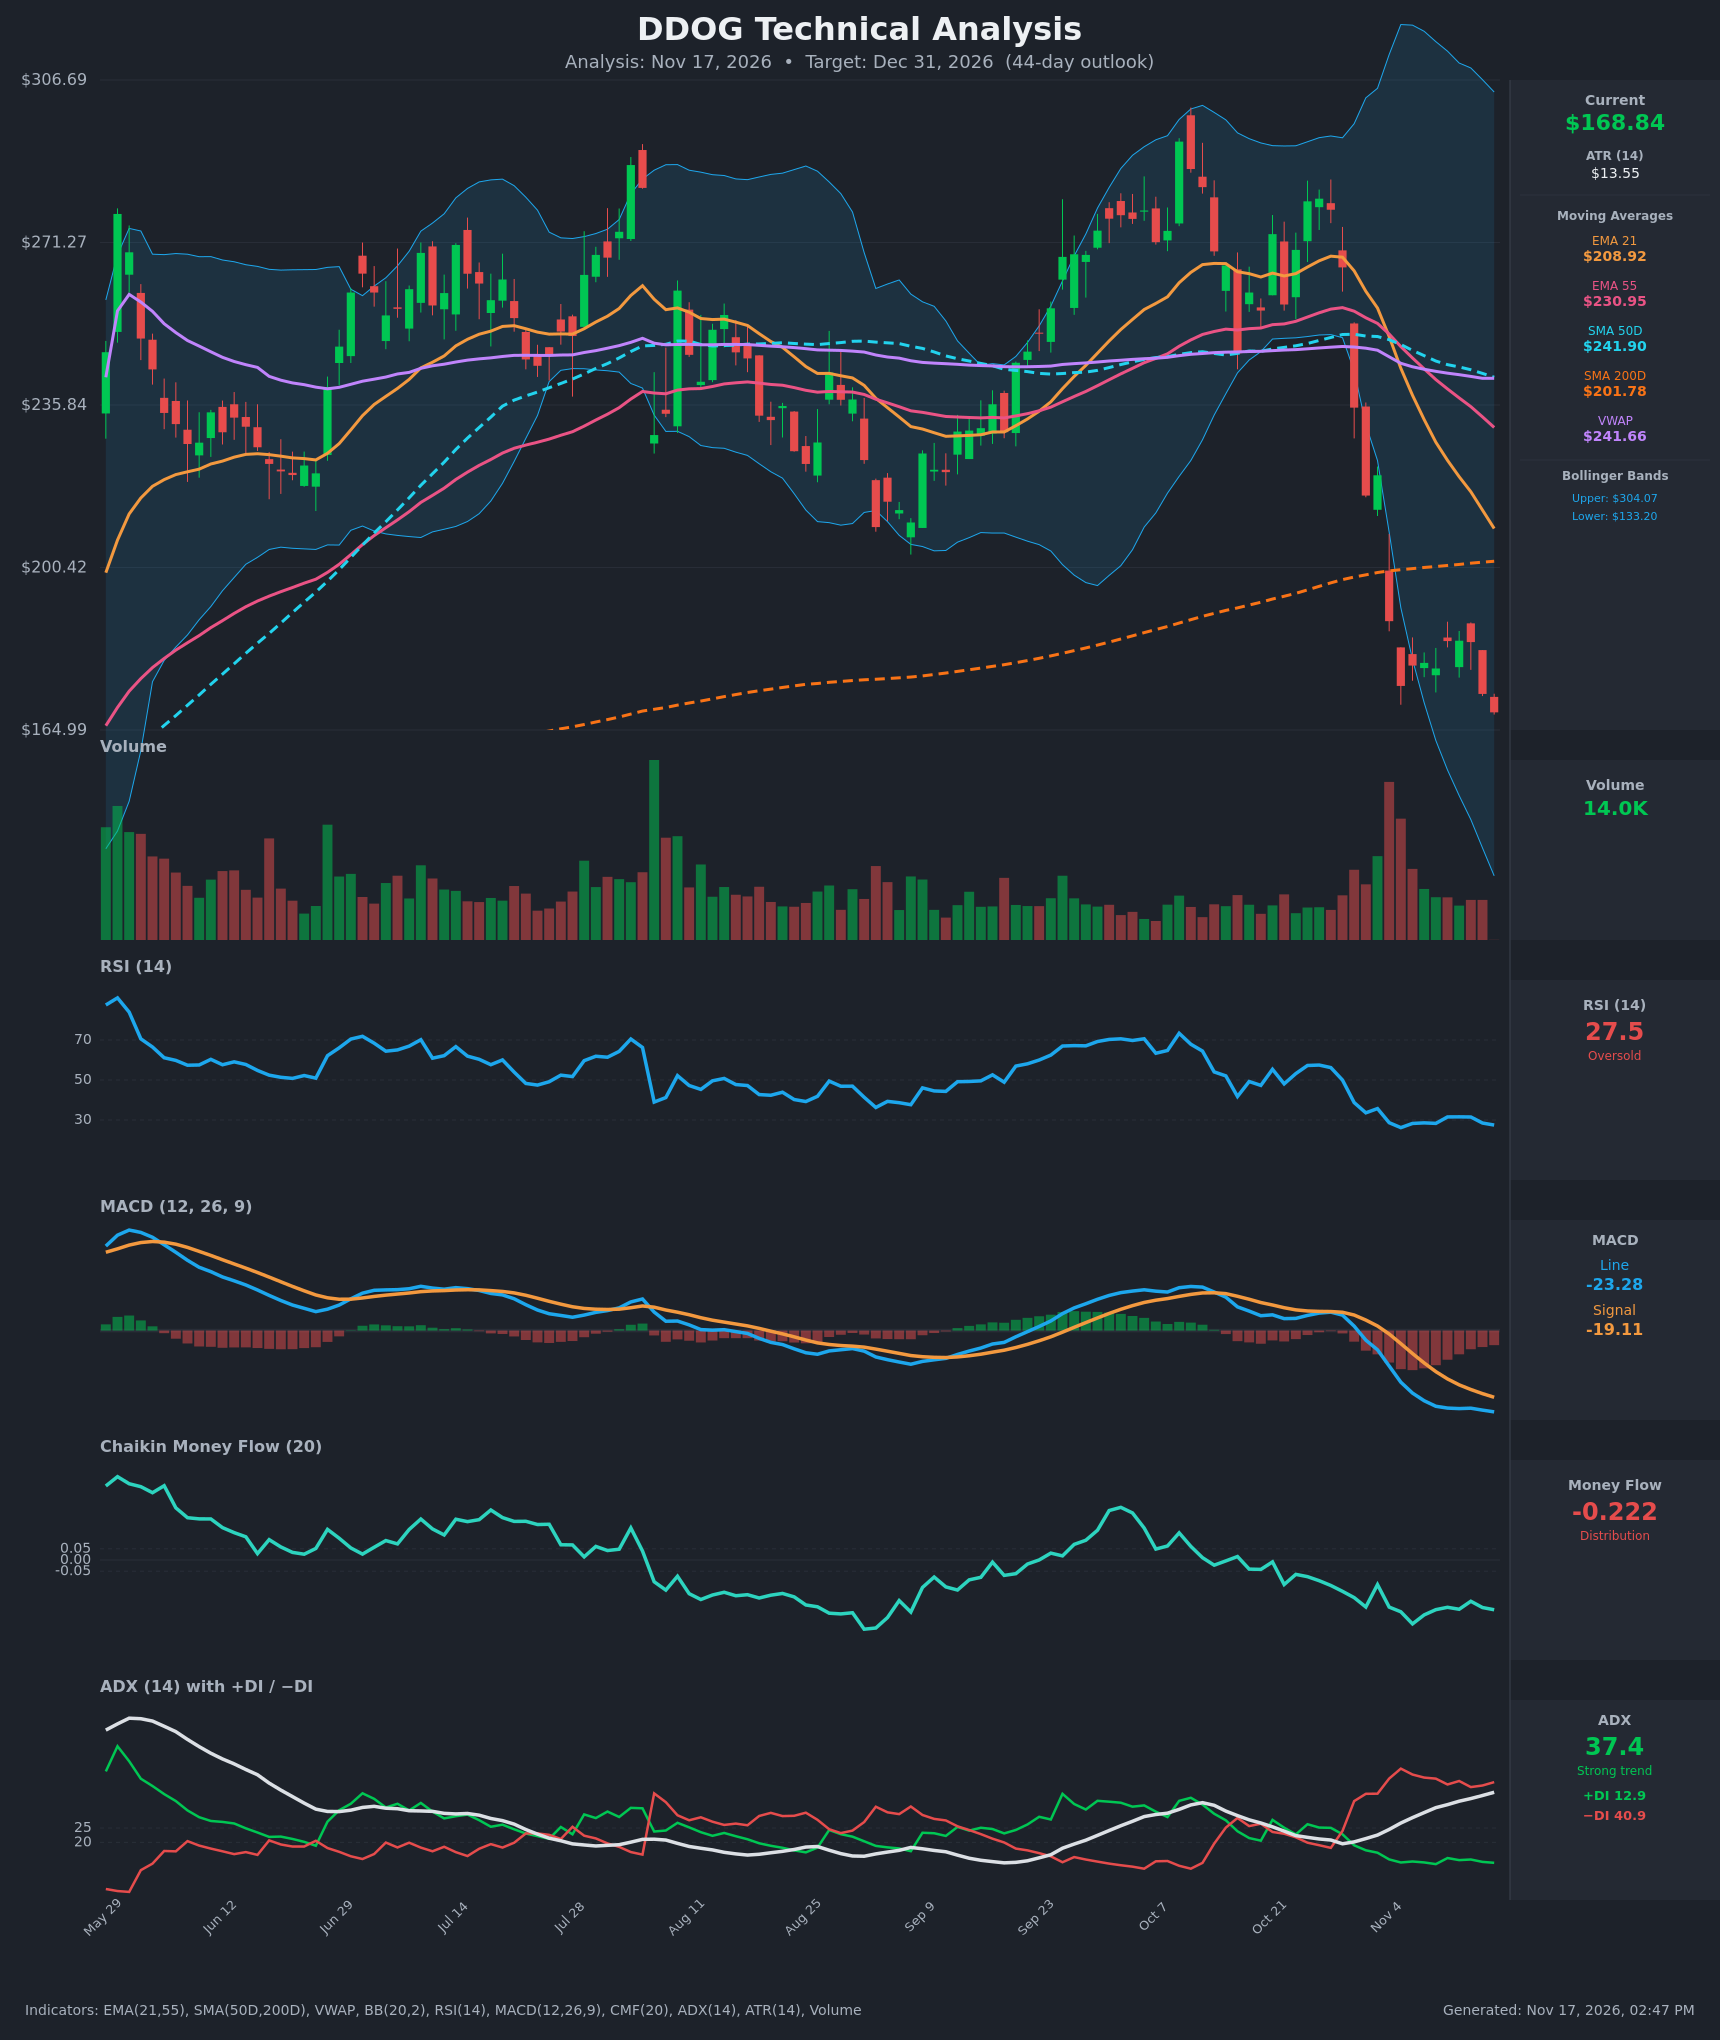
- RSI (14): 27.47, in oversold territory and below 30 for most of the last 8 sessions. It has been trending down from 56 on Oct 28 and has not made a higher low, so momentum is still weak even though a bounce is increasingly likely. [Bearish]
- Moving Averages: Price ($168.84) is below every average. EMA 21 is $208.92, EMA 55 is $230.95, SMA 50D is $241.90, SMA 200D is $201.78 and VWAP is $241.66, so all are overhead resistance. EMA 21 crossed below EMA 55 around Nov 4 (a bearish cross). Price broke below SMA 200D in late October and has not reclaimed it. SMA 50D is rolling over and still sits above SMA 200D, so there is no death cross yet, but the gap is closing ($241.90 vs $201.78). [Bearish]
- MACD: The line (-23.28) is below the signal (-19.11) and both are below zero. The histogram is about -4.2 and widening. The bearish signal cross came around Oct 29 and the line crossed below zero on Nov 2. The line is still making new lows, with no sign of flattening. [Bearish]
- Bollinger Bands (20): The bands are very wide (upper $304.07, lower $133.20) after the sharp selloff, and the lower band is falling steeply. Price is in the lower third of the bands and well below the midline (roughly $219). It has been riding the lower portion since the Nov 4–5 breakdown. Volatility has expanded, and a "walk down the band" is still possible. [Bearish]
- CMF (20): -0.222, well below -0.05. It has been negative since early August, and recent readings between -0.18 and -0.29 show persistent distribution with no accumulation. [Distribution]
- ADX (14): 37.4 and rising from about 20 two weeks ago, with −DI (40.9) far above +DI (12.9). The −DI/+DI gap is very wide. This is a strong, established downtrend with sellers firmly in control. [Strong Trend – Bearish]
- Volume: The latest reading is a low 14.0K. The heaviest volume came during the Nov 4–5 selloff (large red bars), and volume has faded on the lower closes since. Selling pressure is easing in intensity, but there is no volume-backed reversal yet. [Capitulation spike earlier, now fading – cautiously Bearish]
DIVERGENCES & TRENDS
- No bullish RSI or MACD divergence is confirmed. RSI is making marginally lower lows alongside price (28.7 → 26.2 → 27.5, with price at new lows of $168.84), so momentum agrees with price.
- RSI at 27.5 is oversold, but oversold in a strong trend (ADX 37, −DI > 40) often stays oversold. The Nov 5 reading of 26.2 at $174.60 was followed only by a weak bounce to about $184.
- MACD is accelerating downward and the histogram is expanding. This is trend confirmation, not exhaustion.
- ADX rising above 25 with −DI dominant confirms trend strength. A DI cross back up is far off.
- CMF has been negative for months, which shows distribution began well before the breakdown (price was still in the $250–$280 zone in October).
- Price gapped down through the SMA 200D and EMA 21/55 within about two weeks. It now sits roughly 16% below SMA 200D, an unusual stretch that makes a relief rally toward $185–$200 plausible.
CHART PATTERNS
- Bearish Double Top / failed rally structure: The Oct highs near $280–$290 followed by a lower high at ~$278 in late October preceded the break below the August–September lows (~$215). That breakdown is consistent with a reversal pattern. The measured move from the topping range (~$280 to ~$210 neckline) projects roughly $140–$150, close to the lower Bollinger Band ($133).
- Bearish Flag / continuation attempt: Since Nov 5 price has been bouncing in a tight $172–$185 range, a small consolidation after a sharp drop. A break below $172 would project toward $140–$150. A bullish resolution would need a close above ~$185.
- No bullish reversal pattern (double bottom, inverted head and shoulders) is confirmed.
POTENTIAL SCENARIOS
- Scenario 1: Bearish Trend Continuation — The tight $172–$185 base resolves down as sellers (−DI 40.9, CMF −0.22) keep control, and price drifts toward the lower Bollinger Band and the flag measured-move area. Trigger: daily close below $164.99 (the chart low). Target: $135–$150. Invalidation: daily close above $185 with rising volume. (50% probability)
- Scenario 2: Bullish Oversold Relief Bounce — RSI below 30 and a 16% gap below SMA 200D draw in dip buyers, producing a mean-reversion rally toward the SMA 200D and EMA 21 zone, where it likely stalls. Trigger: close above $185 followed by a reclaim of $195. Target: $200–$210 (SMA 200D $201.78, EMA 21 $208.92). Invalidation: failure at $201.78 and a close back below $165. (35% probability)
- Scenario 3: Neutral Choppy Base — Price stays in a wide $150–$195 range as the selloff exhausts without a trend change. Trigger: repeated holds above $160 with fading volume. Target: $160–$185. Invalidation: close outside $150–$195. (15% probability)
PRICE TARGETS
The typical move over 44 days is about $94.21, so the one-move band is $99.14 to $287.56. I shifted that band modestly down toward my bearish bias and widened it to cover both the capitulation downside and the oversold rebound upside.
- Target Price: $152.00 (44-day outlook, about 0.18x a typical move below the current price)
- Expected Range: $90.00 to $270.00 (about 1.9x the typical move wide)
- Key Levels: Support at $164.99, Resistance at $184.50
OVERALL BIAS
OVERALL BIAS: BEARISH - Strong, accelerating downtrend (ADX 37.4, −DI 40.9 vs +DI 12.9), a deepening bearish MACD, persistent distribution (CMF −0.22), and price below all key moving averages including SMA 200D. Oversold RSI (27.5) argues for a relief bounce, so conviction is modest. The target of $152 reflects continuation lower with a likely volatile bounce along the way.
This is educational analysis and not financial advice.