RGTI 4-day bearish forecast — Nov 1, 2026
- Bias: Bearish
- Timeframe: 4 days (made Nov 1, 2026, target date Nov 4, 2026)
- Price at analysis: $11.24
- Price target: $11.05
- Expected range: $10.75 – $11.50
- Result: Correct (0.0%) — closed at $11.24 on Nov 4, 2026; quality score 100/100
Get a free AI analysis of RGTI today
Analysis
TECHNICAL INDICATORS
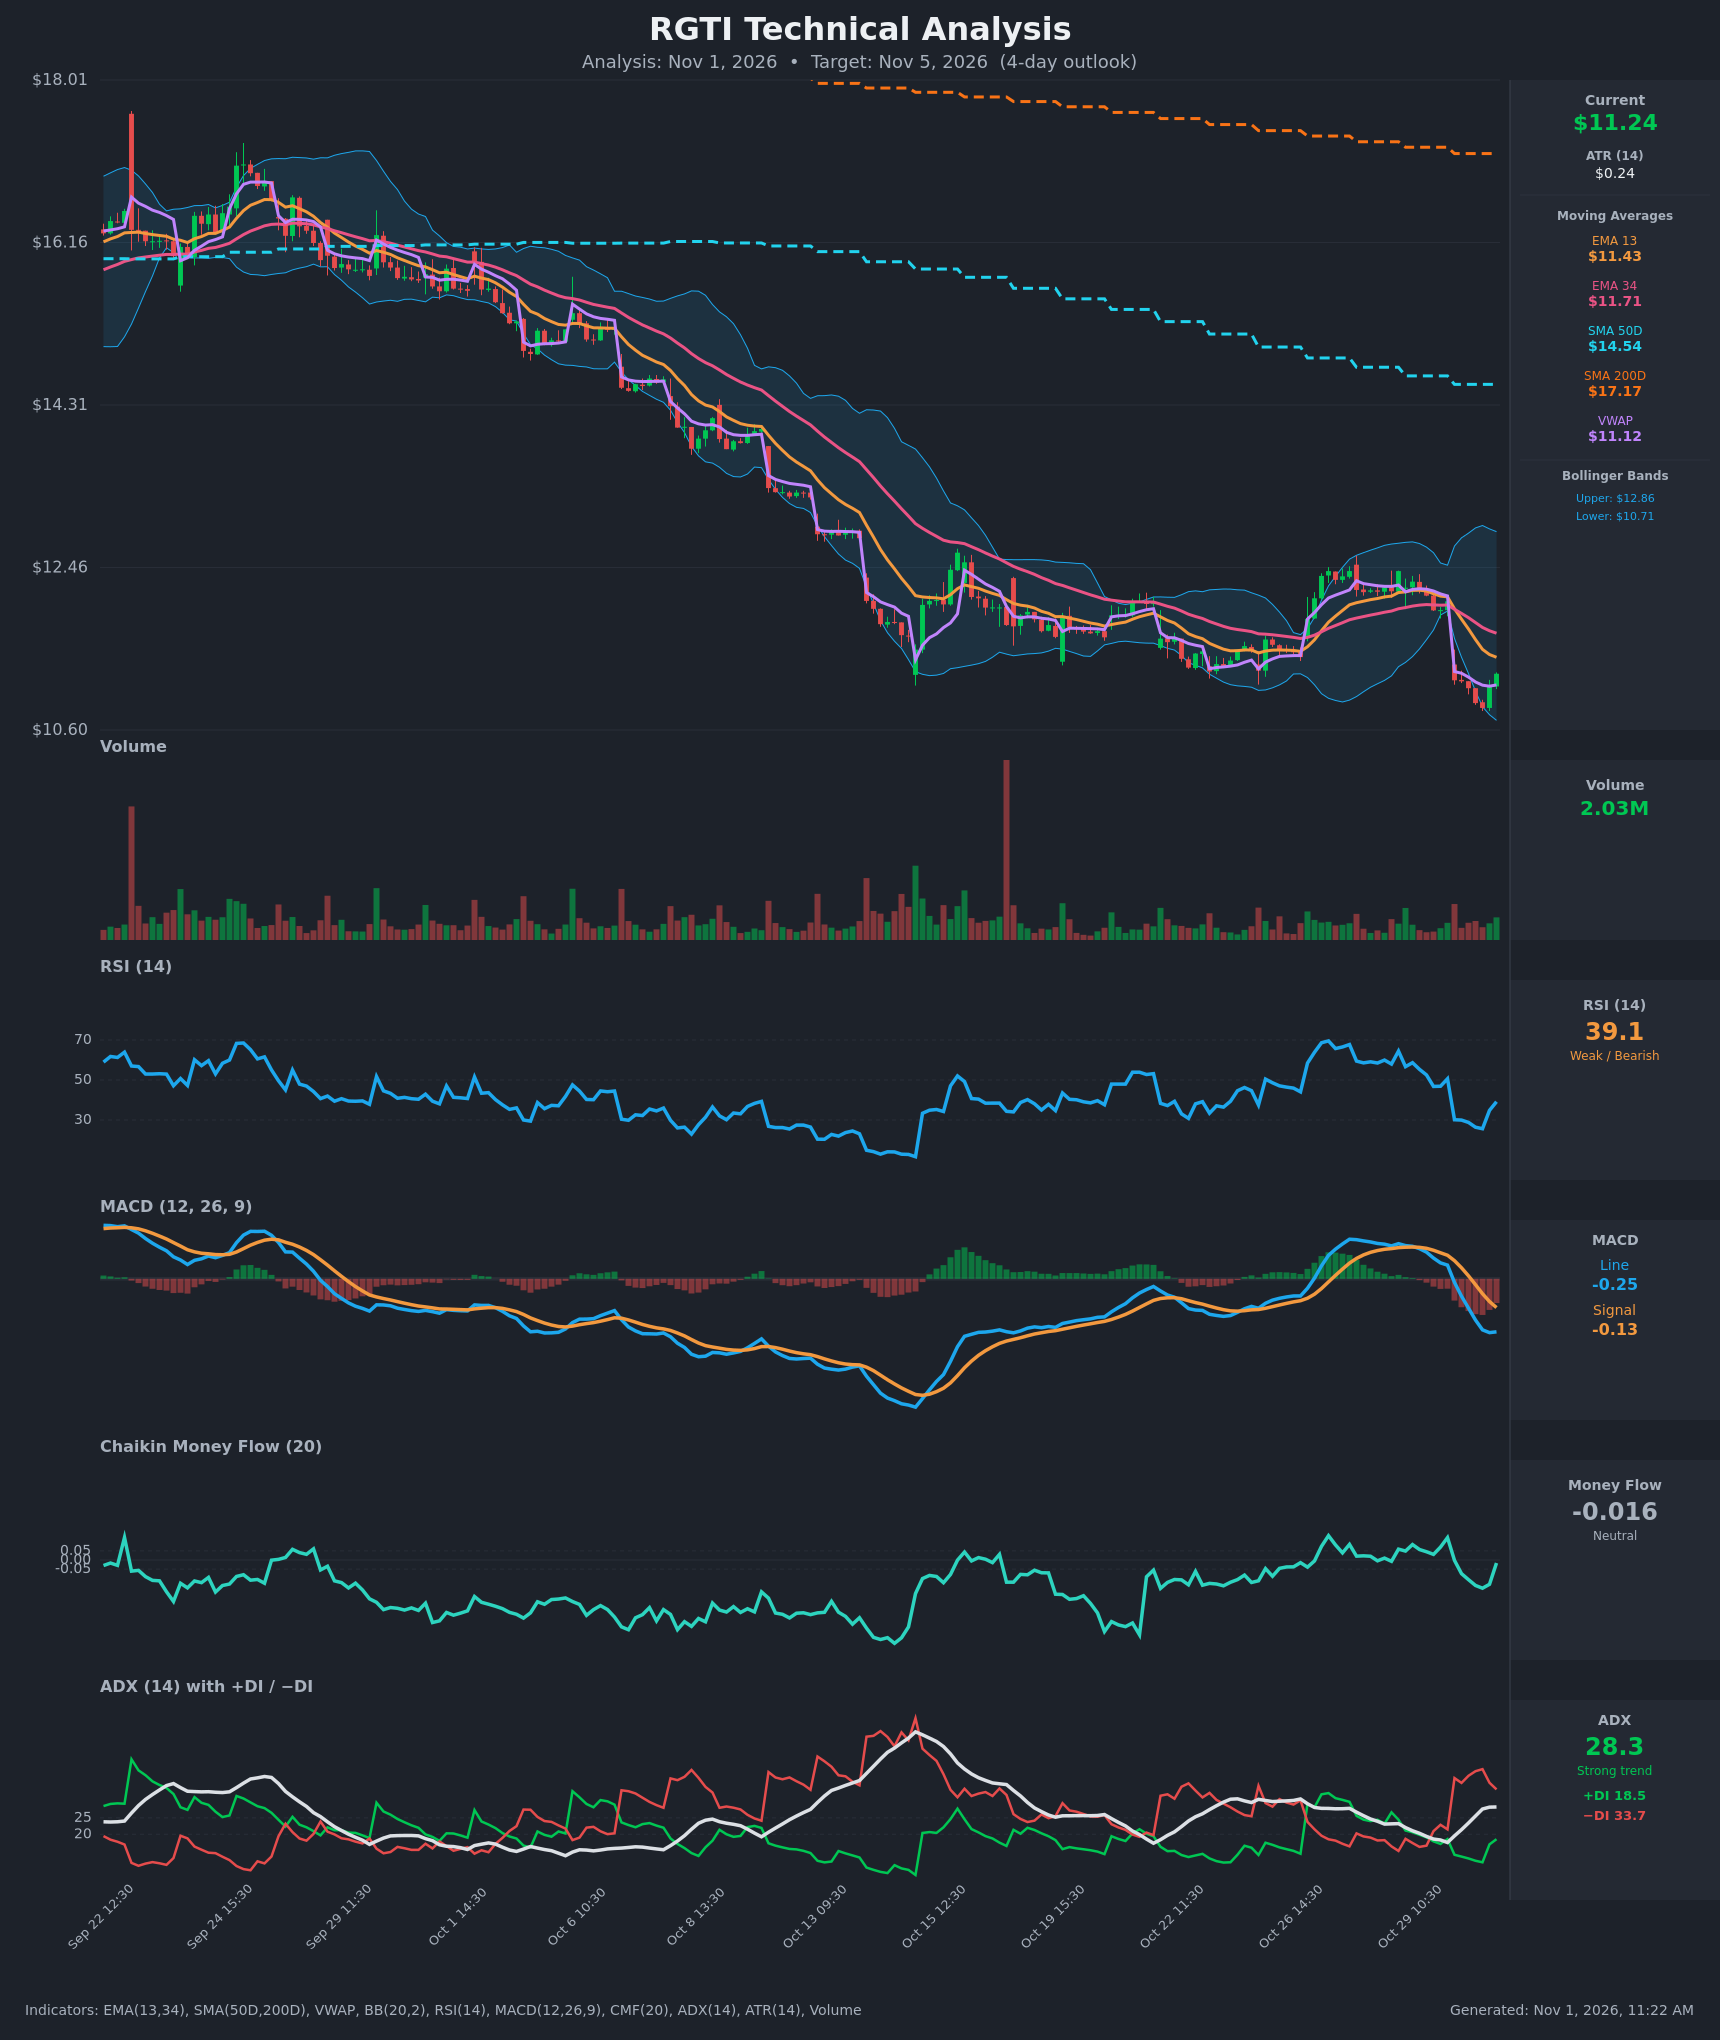
- RSI (14): 39.14, rebounding from an oversold low of about 25.6 on Oct 30 13:30. It is still below 50 and in bearish territory. The bounce is a relief rally rather than a confirmed momentum shift. [Bearish]
- 20 EMA: No 20 EMA was supplied, so I use EMA 13 ($11.43) and EMA 34 ($11.71) as proxies. Price at $11.25 is below both, and EMA13 is below EMA34 and falling. The EMAs are overhead resistance, with EMA13 the first test. [Bearish]
- MACD: Line -0.247 is below signal -0.134, a bearish crossover that happened on Oct 30 around 12:30. The histogram is negative at about -0.11 and widened sharply. The line is flattening (-0.250 → -0.247), a hint that downside momentum is stalling. [Bearish]
- Bollinger Bands (20): Upper $12.86, lower $10.71, midline about $11.79. Price at $11.25 is in the lower third after tagging or piercing the lower band during the Oct 30 gap-down. The bands are wide after the volatility spike. A bounce toward the midline is possible, but the lower-band walk fits a downtrend. [Neutral]
- CMF (20): -0.016, inside the neutral band (±0.05). It improved from -0.155 and is turning up, so selling pressure is easing, but there is no accumulation yet. [Neutral]
- ADX (14): 28.3 with −DI 33.7 above +DI 18.5. The trend is strong and bears are in control. ADX has flattened at 28.3 and the DI spread has narrowed slightly from the extremes (39.8/11.5). [Strong Trend – Bearish]
- Volume: 2.03M on the latest bar, average to slightly above average. The gap-down session had heavier red volume, and the bounce bars are on modest volume without a capitulation spike. The weak bounce volume suggests the rebound lacks conviction. [Neutral to Mildly Bearish]
Other levels:
- VWAP: Price is just above VWAP ($11.12), a small short-term positive that gives immediate support.
- SMA 50D / 200D: SMA50D ($14.54) is far below SMA200D ($17.17), so the death cross is already in place. Price is far below both, which confirms a long-term downtrend.
DIVERGENCES & TRENDS
- There is no clean bullish RSI divergence. The Oct 30 low in price ($10.86) came with RSI near 25, which is lower than the early-October RSI lows, so momentum confirms the price weakness.
- The MACD line is flattening and CMF is rising from -0.155 to -0.016, an early sign of selling exhaustion. It is not yet a reversal signal.
- The Oct 30 09:30 gap from $12.07 to $11.17 broke below the prior consolidation (about $11.9-$12.4). That consolidation is now overhead supply.
- The bearish MACD crossover and the DI flip to −DI dominance (Oct 29 13:30) both confirm the downside shift.
- EMA13 is below EMA34, and both are below the falling SMA50D and SMA200D. The structure is bearish across all timeframes.
CHART PATTERNS
- The broader chart shows a persistent downtrend with lower highs and lower lows since late September. Price made a brief rebound to about $12.4 (Oct 26-29), then failed. This resembles a Bearish Flag/Descending channel continuation, though not a textbook one.
- The late-October consolidation at $11.3-$12.4 was effectively a Bearish Pennant/Flag that resolved down on the gap. The measured move points toward about $10.5.
- The small bounce from the lows could be forming a minor bear flag under the $11.43-$11.70 EMA cluster. Targets are $10.70-$10.80, then the low-$10s.
- A Bullish Falling Wedge is not clearly present, and I do not see enough evidence of a reversal.
POTENTIAL SCENARIOS
- Scenario 1: Bearish Relief-Rally Failure — Price bounces toward the EMA13 (about $11.43) and is rejected by the EMA cluster. Sellers then push it back toward the lower Bollinger Band. Trigger: rejection at $11.40-$11.55 with a break below VWAP ($11.12). Target: $10.75-$10.95. Invalidation: a close above $11.75 (EMA34). (50% probability)
- Scenario 2: Bullish Oversold Bounce — RSI keeps recovering from oversold, CMF turns positive and the MACD histogram stops contracting. Price reclaims the EMAs and heads toward the Bollinger midline. Trigger: a break and hold above $11.45 on rising volume. Target: $11.70-$11.90. Invalidation: a drop below $10.85. (33% probability)
- Scenario 3: Neutral Consolidation — Price chops between VWAP and EMA13 as the volatility spike digests. Trigger: failure to break either $10.90 or $11.50. Target: $11.10-$11.35. Invalidation: a close outside $10.85-$11.55. (17% probability)
PRICE TARGETS
- Target Price: $11.05 (4-day horizon)
- Expected Range: $10.75 to $11.50. Width is $0.75, about 6.7% of the current price, which is appropriate for a 4-day window on a volatile name with ATR spikes and a recent gap.
- Key Levels: Support at $10.75 (lower Bollinger Band area and recent lows), Resistance at $11.45 (EMA13 and the first supply zone)
OVERALL BIAS
OVERALL BIAS: BEARISH - Price is below every moving average, with a bearish MACD crossover, −DI far above +DI and ADX at 28.3 confirming a strong downtrend. The oversold bounce is likely to meet resistance at the EMA13/EMA34 cluster near $11.43-$11.71, though easing selling pressure (CMF) limits the downside to the $10.75 area.
This is educational analysis and not financial advice.