RGTI 83-day bearish forecast — Nov 15, 2026
- Bias: Bearish
- Timeframe: 83 days (made Nov 15, 2026, target date Feb 5, 2027)
- Price at analysis: $9.62
- Price target: $8.60
- Expected range: $6.60 – $12.00
- Result: Pending — graded after the close on Feb 5, 2027
Get a free AI analysis of RGTI today
Analysis
TECHNICAL INDICATORS
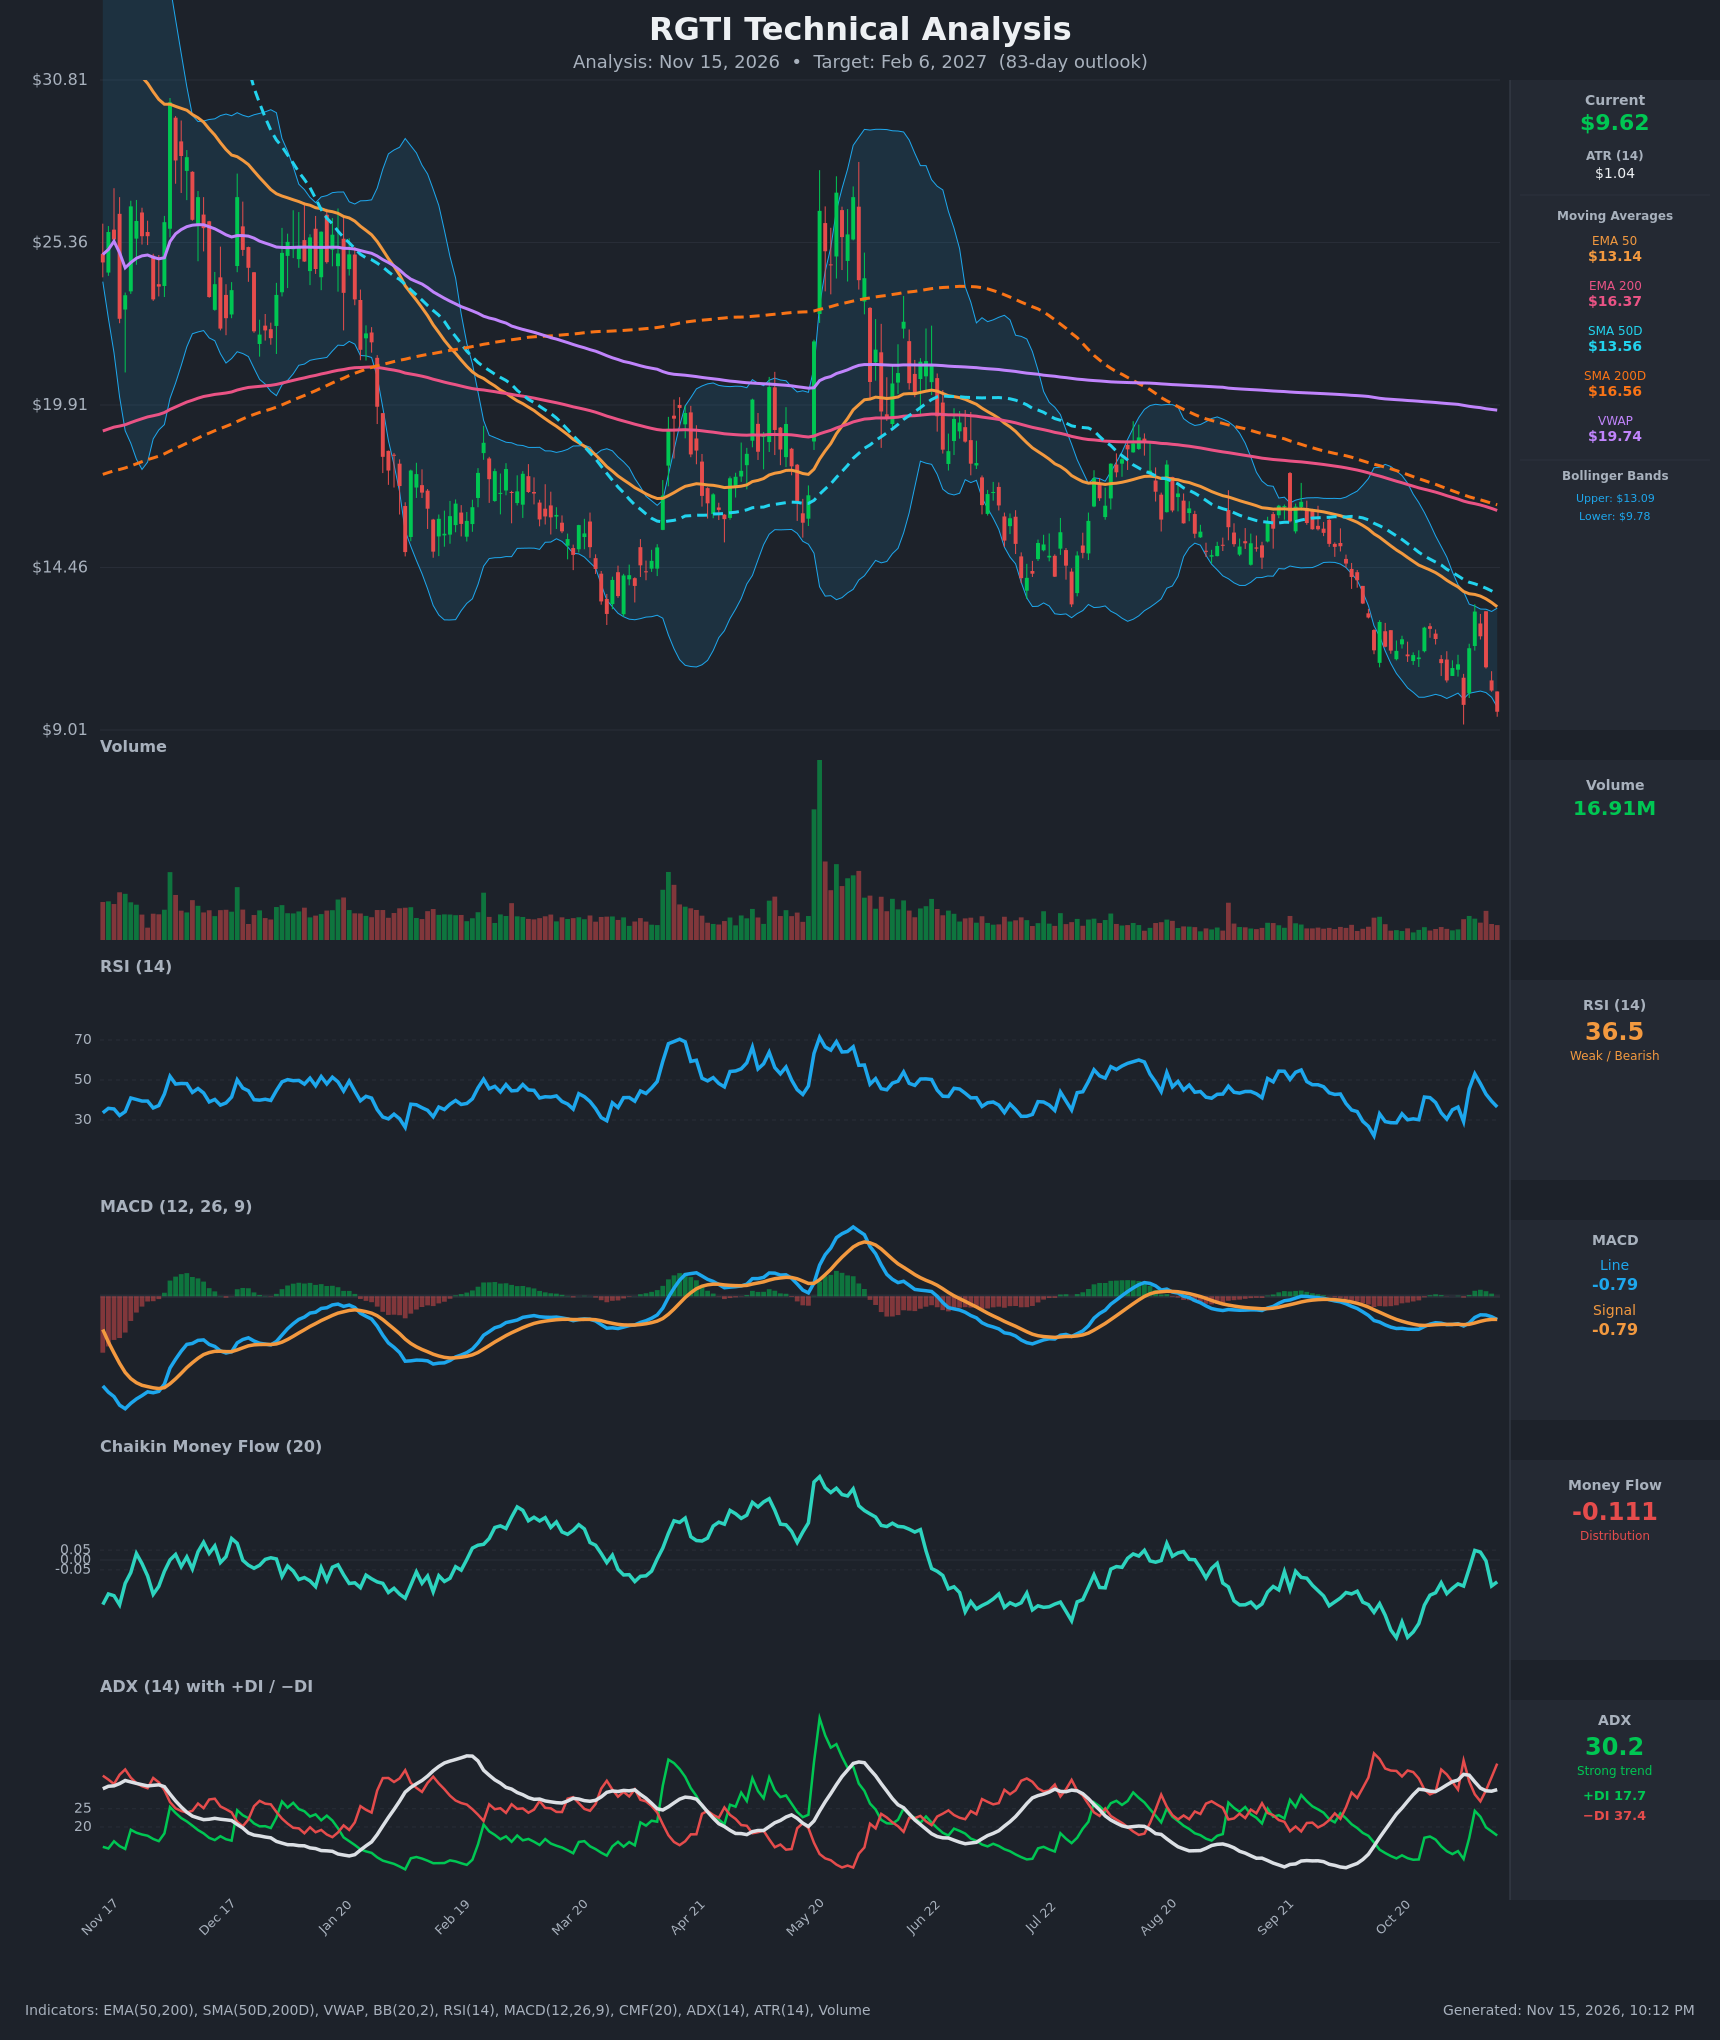
- RSI (14): 36.51, down from 53.1 on Nov 9 and below the 50 midline. It is not yet oversold (<30), but it has hit 29–30 three times in the past three weeks (Oct 26, Nov 2, Nov 5), and each bounce faded quickly. Momentum is weak and rolling over again. [Bearish]
- 20 EMA: Not supplied. The 20-period mean is the Bollinger midline, which sits near $11.4–11.5, well above the $9.62 price. EMA 50 ($13.14) and EMA 200 ($16.37) are stacked above price and sloping down. Price is below every moving average, so they all act as resistance. [Bearish]
- MACD: Line -0.792 vs signal -0.788, a marginal bearish crossover (the line was above the signal on Nov 10–12). The histogram has turned slightly negative at about -0.004. The line has fallen from -0.632 to -0.792 in 3 sessions, and both lines sit below zero. [Bearish]
- Bollinger Bands (20): Upper $13.09, lower $9.78. Price at $9.62 is below the lower band, a statistically stretched close. In a strong downtrend this is "walking the band" rather than a reliable reversal signal. The bands are wide (~$3.3), reflecting high volatility. A snapback toward the midline is possible, but the trend bias is down. [Bearish]
- CMF (20): -0.111, below the -0.05 threshold. It briefly touched +0.049 on Nov 9 and has since rolled back into distribution. Rallies are being sold. [Distribution]
- ADX (14): 30.2 with -DI at 37.4 and +DI at 17.7. -DI has a wide lead and the spread is widening again (it was 27.0 vs 22.8 on Nov 10). The trend is strong and bearish. [Strong Trend - Bearish]
- Volume: 16.91M on the latest bar, with volume rising modestly in recent sessions. Selling bars at the lows carry decent volume, but there is no capitulation spike like the May surge. This looks like sustained distribution rather than a climactic bottom. [Bearish / no capitulation yet]
DIVERGENCES & TRENDS
- Divergences: No clear bullish RSI divergence. Price made a lower low ($9.62 vs $9.85 on Nov 5), while RSI at 36.5 is higher than the 29.2 it showed on Nov 5. That is a mild, unconfirmed bullish divergence, but the RSI bounce to 53 failed, which weakens it.
- Trend: Price is far below SMA200D ($16.56) and EMA200 ($16.37), and well below VWAP ($19.74). The long-term downtrend is intact, with lower highs since the May peak (~$27).
- MA structure: SMA50D ($13.56) is well below SMA200D ($16.56). The death cross is established, and the gap is narrowing only slowly. EMA50 is below EMA200 and still falling about $0.10–0.15 per bar.
- Crossovers: MACD just crossed down again. The DI spread is re-widening with -DI dominant.
- Failed bounce: The Nov 9 rally to $12.98 was rejected right below EMA50 ($13.55), with a swift reversal.
CHART PATTERNS
- Primary pattern: a descending channel of lower highs and lower lows since the May peak, consistent with a continuation downtrend. The recent compressions near $11–13 resemble a Bearish Flag / Pennant within the trend, and the flag is now breaking down.
- Bullish counter-pattern: a possible Bullish Falling Wedge or double bottom at $9.85/$9.62, but it is unconfirmed. It would need a reclaim of about $11.5–13.
- Targets: the flag-pole measure (roughly $13 → $9.8, about $3.2) projects to roughly $6.5–7.0 on a clean break below $9.50. Support is thin, since price is near multi-month lows.
POTENTIAL SCENARIOS
- Scenario 1: Bearish Trend Continuation — Price breaks below $9.50, with -DI dominant, CMF in distribution, and all MAs overhead. It grinds lower toward the flag-pole target. Trigger: daily close below $9.50 on rising volume. Target: $7.00–$8.00. Invalidation: daily close above $11.50 (Bollinger midline). (50% probability)
- Scenario 2: Neutral Base and Range — Oversold conditions below the lower band and a mild RSI divergence produce a base between about $8.50 and $12.00, with choppy trading around $9–11. Trigger: stabilization above $9.50 with RSI holding above 30. Target: $9.50–$11.00. Invalidation: close below $8.50 or above $13.10. (22% probability)
- Scenario 3: Bullish Oversold Reversal — A sharp mean-reversion rally, typical of this high-volatility stock (it rallied from $9.85 to $12.98 in 2 days). Price reclaims EMA50 and tests the SMA50D. Trigger: close above $11.50 with CMF turning positive. Target: $13.50–$14.50. Invalidation: close back below $9.60. (28% probability)
PRICE TARGETS
For the 83-day timeframe (Feb 6, 2027), the range width should be ~18–30% of price; with this stock's high volatility, I'm using the wider end.
- Target Price: $8.60
- Expected Range: $6.60 to $12.00 (width $5.40 ≈ 56% of current price; this is deliberately wider than the formula's 18–30% because RGTI's ATR is ~11% of price)
- Key Levels: Support at $9.00, Resistance at $11.50
Self-check: the range width is wider than any shorter-timeframe range would be, and the target ($8.60) is below the current price of $9.62, consistent with a bearish bias.
OVERALL BIAS
OVERALL BIAS: BEARISH - Price is below every moving average with an established death cross. ADX of 30 shows a strong trend with -DI dominant (37.4 vs 17.7), CMF is in distribution, MACD has re-crossed down, and recent bounces have failed at EMA50. Oversold conditions could trigger sharp relief rallies, but the weight of evidence favors lower prices over 83 days.
This is educational analysis and not financial advice.