RGTI 20-day bearish forecast — Nov 15, 2026
- Bias: Bearish
- Timeframe: 20 days (made Nov 15, 2026, target date Dec 4, 2026)
- Price at analysis: $9.62
- Price target: $9.20
- Expected range: $8.65 – $9.80
- Result: Pending — graded after the close on Dec 4, 2026
Get a free AI analysis of RGTI today
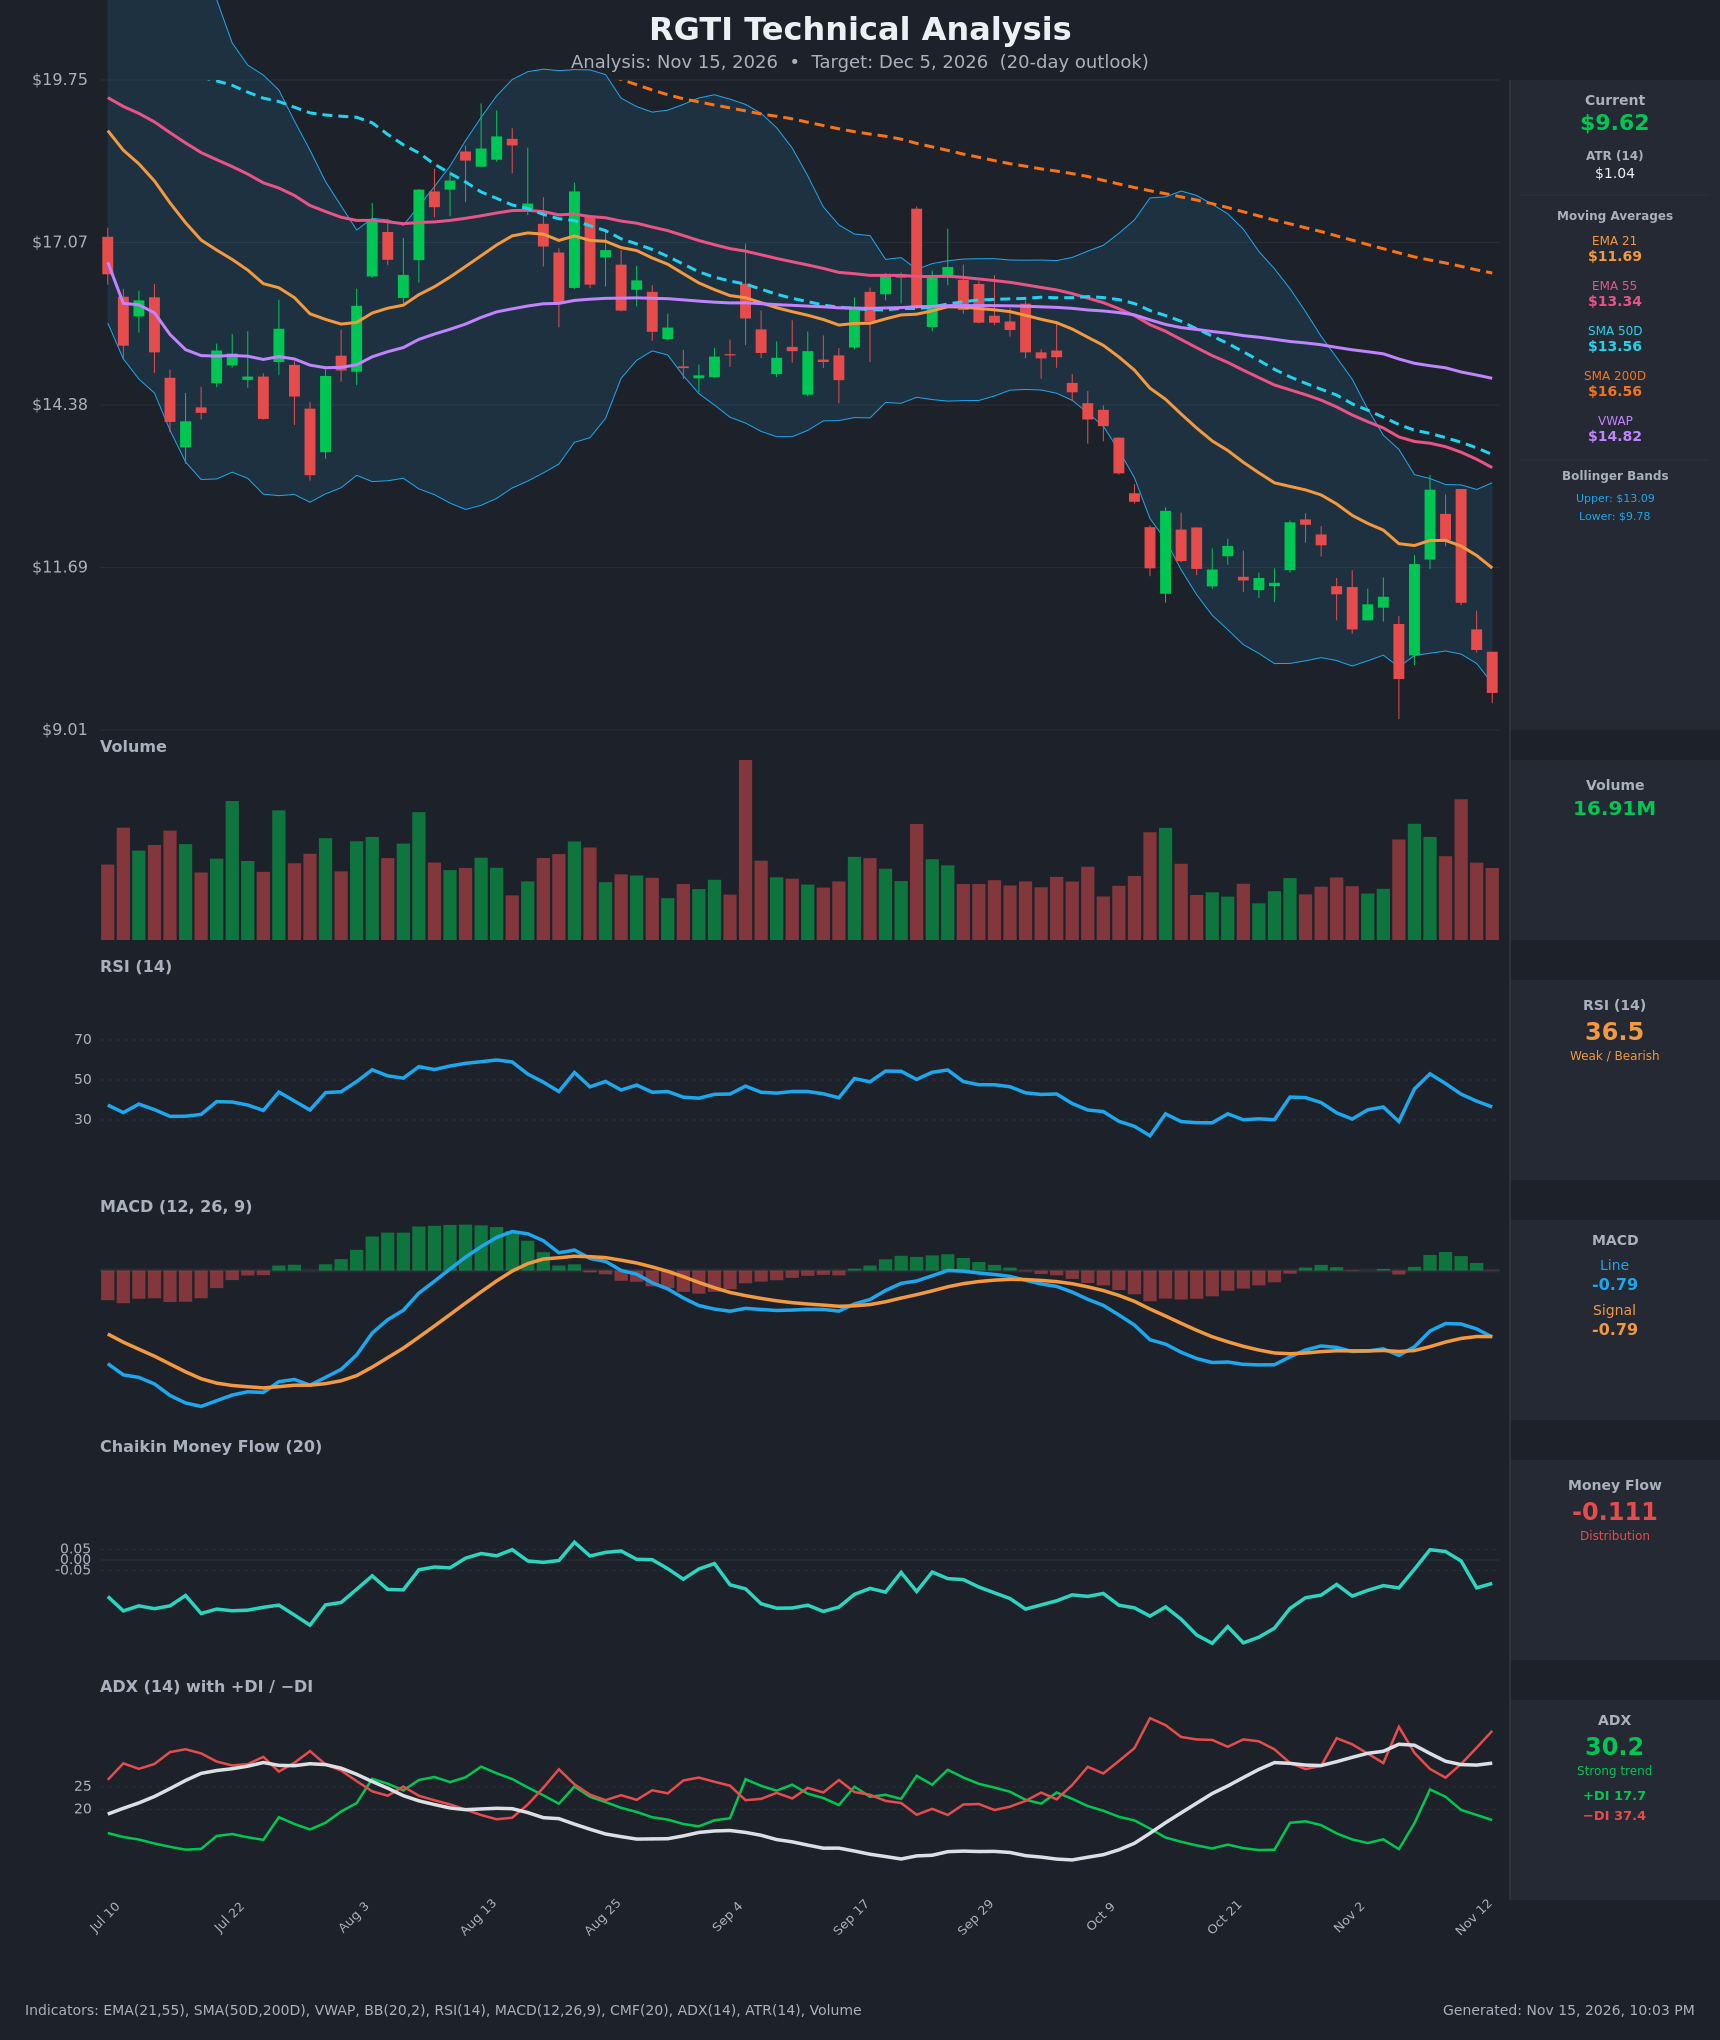
Analysis
TECHNICAL INDICATORS
- RSI (14): 36.51, down from 53.1 on Nov 9. It is weak but not oversold (<30), and it sits below the 50 midline with falling momentum. The recent lows at 29-30 (Oct 26, Nov 5) produced only brief bounces. [Bearish]
- 20 EMA (EMA 21 = $11.69): Price at $9.62 is about 18% below the EMA 21. The EMA 21 is also below the EMA 55 ($13.34), so the EMAs are in a bearish alignment. The EMA 21 is a falling dynamic resistance, and rallies have failed near it (Nov 9-10 at about $12.1-12.2). [Bearish]
- MACD: Line -0.792 vs signal -0.788, so the line has just crossed back below the signal. The histogram is flat to slightly negative. The recent bullish cross (Nov 9) was shallow, occurred below zero, and has now reversed. [Bearish]
- Bollinger Bands (20): Price is $9.62, just below the lower band ($9.78), with the upper band at $13.09 and the midline around $11.4. The close outside the lower band shows a strong downside push. Bands are wide, so volatility is high. A bounce toward the midline is possible, but walking the lower band is common in downtrends. [Bearish]
- CMF (20): -0.111, below the -0.05 threshold. It briefly turned positive on Nov 9-10 (+0.049), then fell back, so the buying was not sustained. [Distribution]
- ADX (14): 30.2 with −DI at 37.4 and +DI at 17.7. ADX is above 25 and rising, so the trend is strong. The −DI is far above the +DI, and the spread has widened again since Nov 9. [Strong Trend – Bearish]
- Volume: 16.91M, with large bars on both the Nov 9 spike and the sell-offs since. The heaviest volume has come on red candles (Nov 5, Nov 12-13), which points to active selling. There is no volume capitulation signature yet. [Bearish – selling pressure]
Other moving averages:
- SMA50D is at $13.56 and SMA200D at $16.56. Both are far above price, and the SMA50D is already below the SMA200D (death cross in place).
- VWAP is at $14.82, well above price, so sellers dominate.
DIVERGENCES & TRENDS
- No bullish divergence: RSI made a lower low on Nov 5 (29.2) when price closed at $9.85, but the current price of $9.62 is a new low with RSI at 36.5. That is a higher RSI than at the prior low. This is a mild bullish divergence, but it is unconfirmed and weak.
- Trend: The price structure is lower highs and lower lows since early October ($12.98 → $9.62). All moving averages are stacked bearishly (price < EMA21 < EMA55 < SMA50 < VWAP < SMA200).
- Crossovers: The MACD re-crossed bearishly. The DI spread (−DI over +DI) re-widened after the brief Nov 9 narrowing. The bullish CMF flip was short-lived.
- Choppy recovery attempts: The wide-range candles in November (Nov 5 → Nov 9 swing from $9.85 to $12.98) show failed reversals. Each rally has been sold within 1-2 days.
CHART PATTERNS
- Bearish continuation (descending trend/channel): The series of lower highs and lower lows resembles a bearish flag or descending structure. Failure to hold $10 would extend the move toward the $9.0 area (the chart low) and possibly lower.
- Possible bullish falling wedge / double-bottom attempt (lower probability): Price has tested the $9.2-$9.85 zone several times (Nov 5 and now). A hold followed by a close back above $10.67-$11.1 would hint at a double bottom or falling-wedge reversal. The pattern is not confirmed, because lower highs and the −DI dominance remain intact.
- Measured target: The prior range break from about $12.5 to $11 and then to $9.6 suggests continued stepwise declines. A drop to about $9.0 is the first objective, and below $9.0 opens a sharper leg.
POTENTIAL SCENARIOS
- Scenario 1: Bearish Trend Continuation — Price remains below the falling EMA 21 and extends the downtrend, with a lower-band walk. Distribution (CMF < -0.05) and −DI dominance persist. Trigger: close below $9.30 with volume above 15M. Target: $9.00-$9.20 (chart low), with an extension to about $8.70. Invalidation: daily close above $11.00 (EMA 21 area is $11.69). (50% probability)
- Scenario 2: Bullish Oversold Bounce / Double-Bottom Attempt — Price holds the $9.0-$9.5 zone, RSI hovers near 30-35, and a mean-reversion rally runs toward the BB midline. Trigger: close above $10.67 with MACD rising and CMF back above 0. Target: $11.40-$11.70 (EMA 21 / BB midline). Invalidation: close below $9.00. (30% probability)
- Scenario 3: Neutral Choppy Range — Price oscillates between $9.2 and $10.7 as volatility compresses and ADX fades. Trigger: lack of follow-through on both sides. Target: $9.60-$10.20. Invalidation: close outside $9.00-$10.70. (20% probability)
PRICE TARGETS
- Target Price: $9.20 (20-day target for Dec 5, 2026)
- Expected Range: $8.65 to $9.80 (width $1.15, about 12% of current price, consistent with the 14-21 day guidance)
- Key Levels: Support at $9.00, Resistance at $10.67
OVERALL BIAS
OVERALL BIAS: BEARISH - Price is below every moving average and at the lower Bollinger Band. ADX is 30 with −DI (37.4) far above +DI (17.7), CMF shows distribution, and the MACD has re-crossed bearishly. The mild RSI divergence and oversold-bounce risk keep conviction moderate, and I expect a drift toward the $9.0-$9.2 area.
This is educational analysis and not financial advice.