RGTI 13-day bearish forecast — Nov 1, 2026
- Bias: Bearish
- Timeframe: 13 days (made Nov 1, 2026, target date Nov 13, 2026)
- Price at analysis: $11.24
- Price target: $10.95
- Expected range: $10.30 – $11.65
- Result: Correct (-15.4%) — closed at $9.51 on Nov 13, 2026; quality score 50/100
Get a free AI analysis of RGTI today
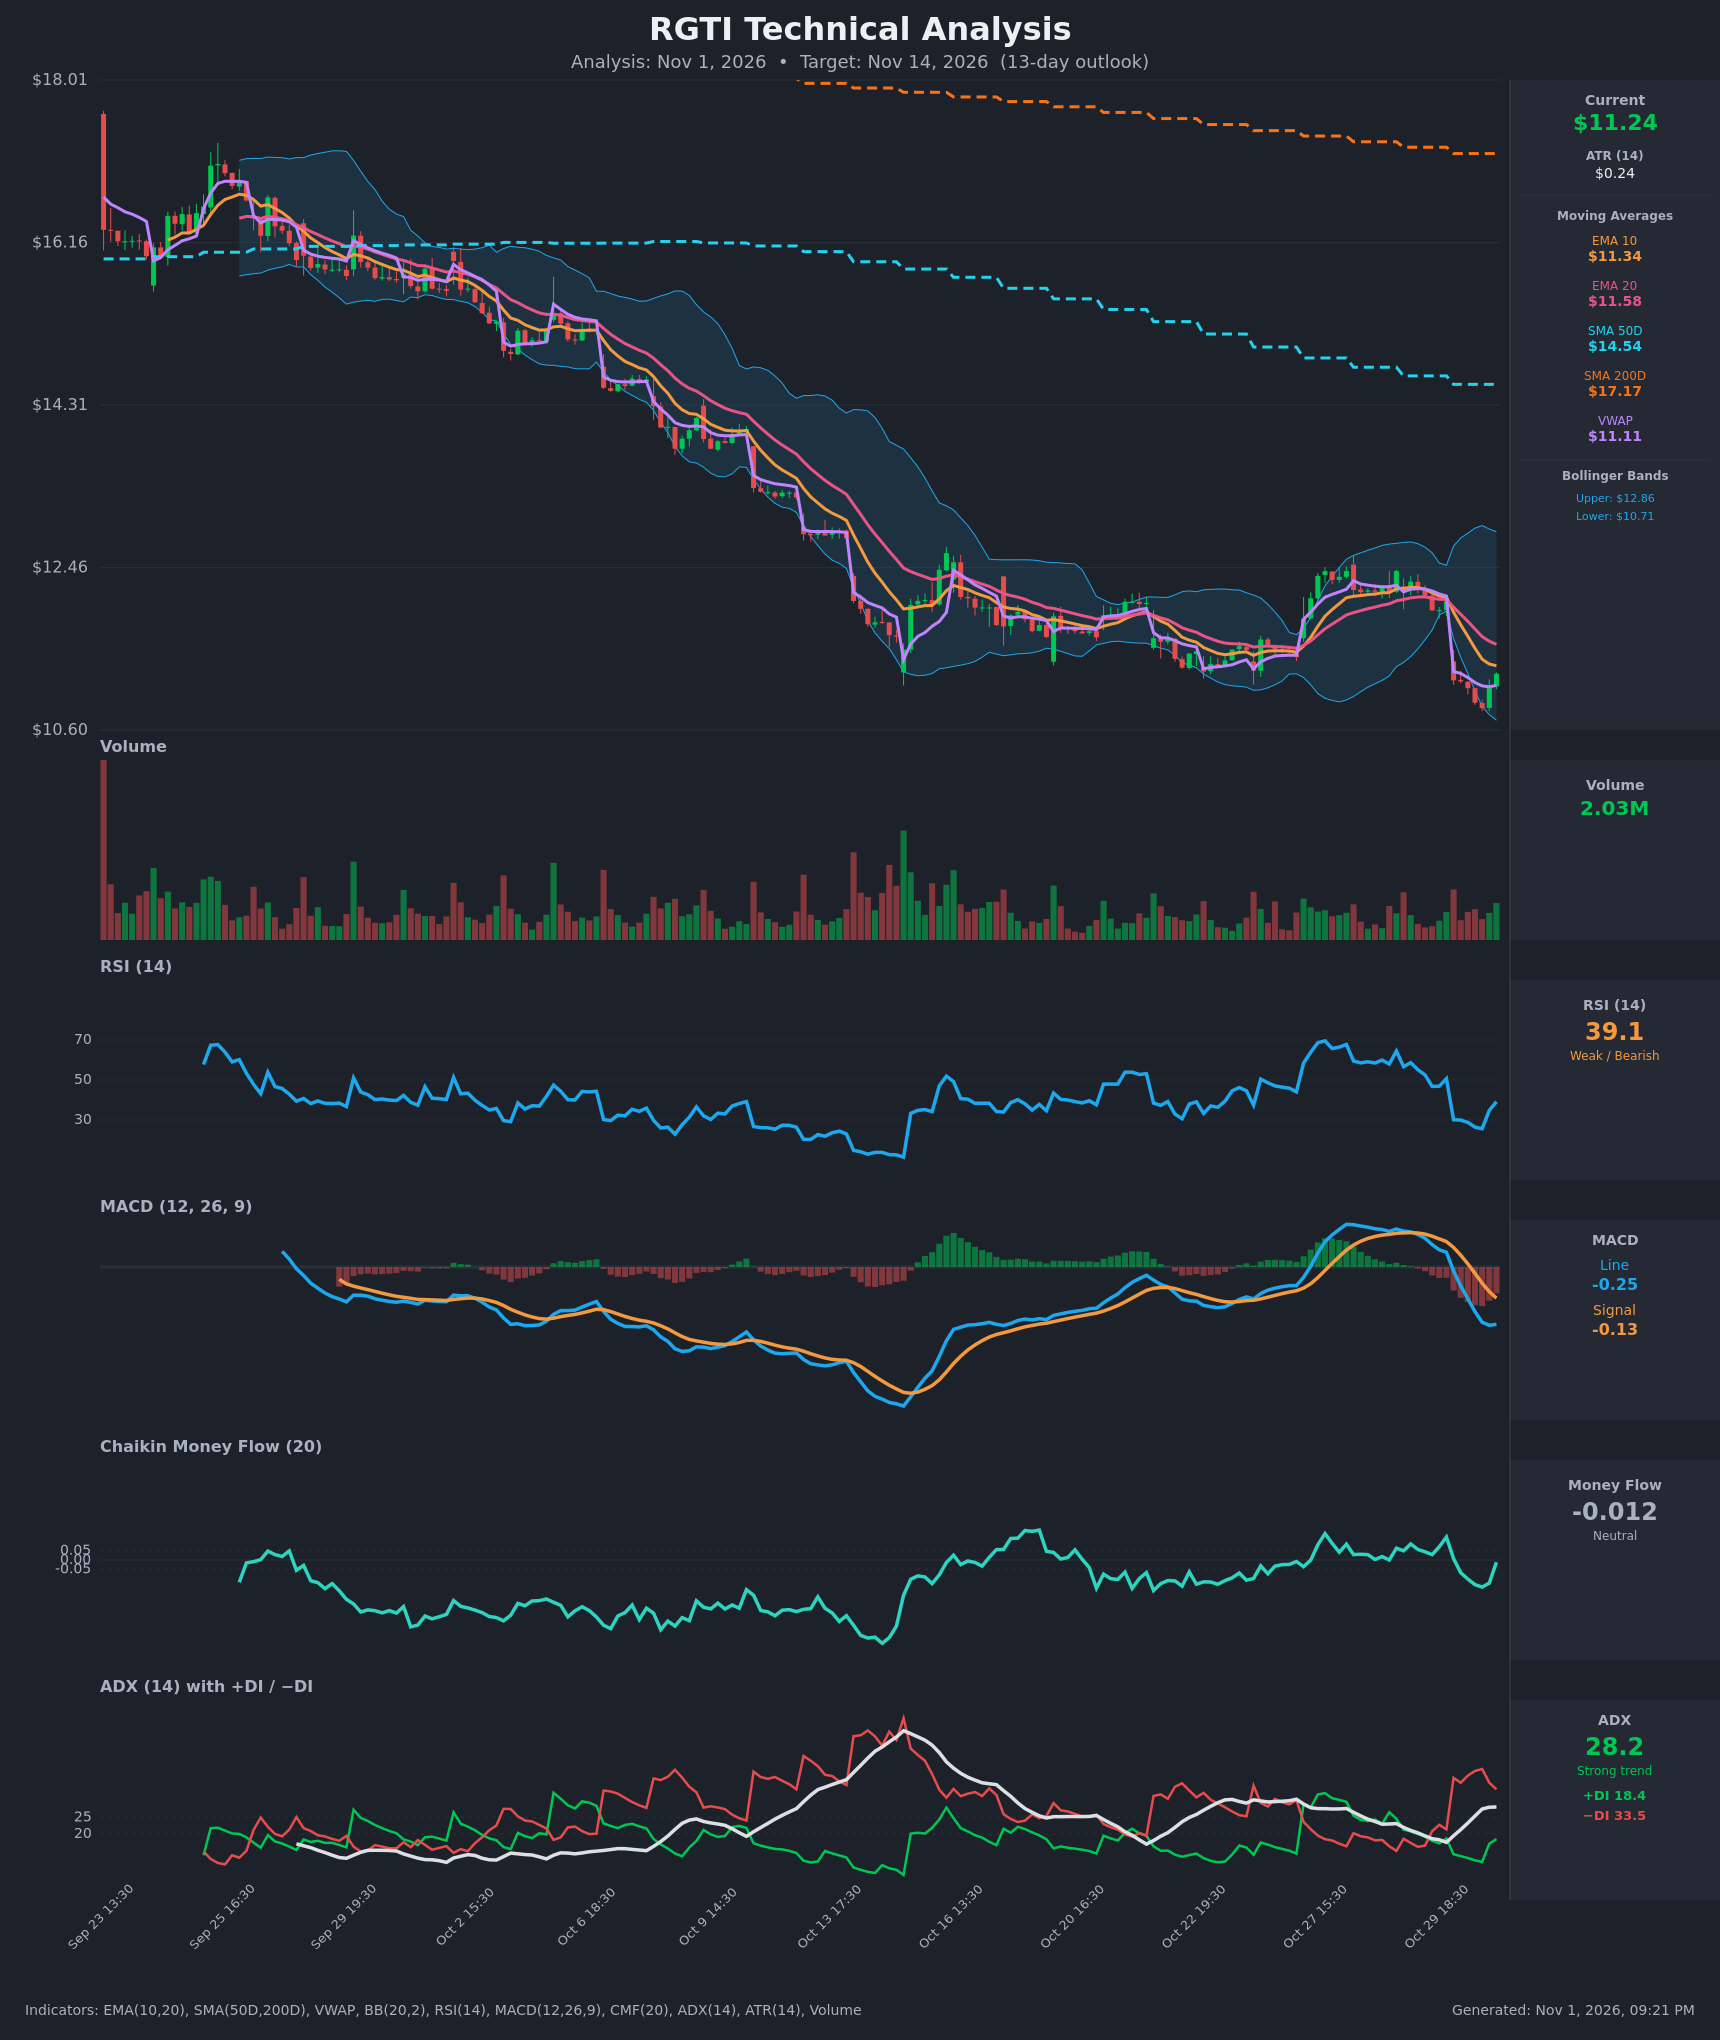
Analysis
TECHNICAL INDICATORS
- RSI (14): 39.14, bouncing from an oversold 25.6 on Oct 30 (it was 64.5 on Oct 28). It is recovering but still below 50, so the bounce has not yet shifted momentum. [Bearish]
- 20 EMA: $11.58, with price ($11.245) below it. The EMA10 ($11.34) is also above price and sits under the EMA20, so the bearish stack is intact. Both are overhead resistance. [Bearish]
- MACD: Line -0.246 is below signal -0.134. The bearish crossover occurred Oct 30 (the line crossed below the signal around 13:30–14:30), and the histogram is about -0.11. The line is flattening (-0.250 to -0.246), so downside momentum is easing but not reversed. [Bearish]
- Bollinger Bands (20): Upper $12.86, lower $10.71, midline about $11.79. Price touched the lower band area at $10.86 and bounced to $11.245, which is in the lower third of the range. The bands are wide after the Oct 30 gap down. [Bearish]
- CMF (20): -0.012, neutral. It recovered from -0.145 to the neutral zone, so selling pressure has faded, but there is no accumulation signal yet. [Neutral]
- ADX (14): 28.2 and rising, with −DI (33.5) well above +DI (18.4). This is a strong downtrend with bears in control. The DI spread is narrowing from the peak (39.7 vs 11.5). [Strong Trend – Bearish]
- Volume: 2.03M on the latest bar, with the bounce candle printing green. Volume is moderate and does not show a capitulation spike, so the bounce is not strongly confirmed. [Neutral / Weak confirmation of bounce]
DIVERGENCES & TRENDS
- Long-term structure: Price is well below SMA50D ($14.54) and SMA200D ($17.17). The SMA50D is below the SMA200D, so a death cross is already in place. The long-term trend is firmly down, and both SMAs are still falling.
- Short-term pivot: On Oct 30 price gapped down from $12.07 to $11.17 and then slid to a low of $10.86. The last two bars (green) show a bounce, with the final close at $11.245, just above VWAP ($11.11).
- Possible mild bullish divergence: RSI made its low at 25.6 when price was at $10.86, and RSI is now recovering. MACD is also flattening. This is a relief bounce setup, not a confirmed reversal.
- Crossovers: The EMA10 crossed below the EMA20 on Oct 30 (bearish). The MACD bearish cross is also fresh. There is no +DI/−DI bullish cross.
- Prior range: From Oct 13 to Oct 29 price consolidated at roughly $11.2–$12.5, and the Oct 30 gap broke below the bottom of that range. The old range floor around $11.3–$11.6 is now resistance.
CHART PATTERNS
- Bearish continuation / failed range: Price broke down from the Oct 16–29 consolidation (a rectangle-like range) with a gap. This resembles a bearish continuation. The measured move of the prior range (about $1.3 tall) projects to roughly $10.0–$10.3 from the breakdown area.
- Longer-term: A persistent staircase of lower highs and lower lows since late September, consistent with a falling channel under the declining SMAs.
- Bullish caveat: The current bounce from the lower Bollinger Band, together with RSI turning up from oversold, could form a short-term base resembling a Bullish Falling Wedge or Double Bottom area near $10.86. That would need a close above the EMA20 (about $11.58) to confirm, and it is not yet in place.
POTENTIAL SCENARIOS
- Scenario 1: Bearish Trend Continuation — The bounce stalls beneath the EMA10/EMA20 ($11.34–$11.58) and the old range floor, and sellers push price to retest and break the $10.86 low. The strong ADX with −DI dominance favors this. Trigger: rejection at $11.35–$11.60 or a close below $10.90. Target: $10.20–$10.50. Invalidation: daily close above $11.90. (50% probability)
- Scenario 2: Bullish Relief Bounce, Then Fade — Oversold RSI and the lower-band touch fuel a bounce to the EMA20/midline area, then price stalls below $12.0. Trigger: close above $11.60 with rising volume. Target: $11.80–$12.20. Invalidation: close below $10.85. (30% probability)
- Scenario 3: Neutral Choppy Base — Price oscillates between $10.80 and $11.70 as momentum resets. Trigger: ADX falling below 25 and CMF staying near zero. Target: $11.00–$11.50. Invalidation: break of either boundary on volume. (20% probability)
PRICE TARGETS
Timeframe: 13 days. The range width should be about 8–12% of the current price, which is $0.90–$1.35 on $11.245. Given RGTI's high volatility, I use the upper end of that guidance, about 12% ($1.35).
- Target Price: $10.95 (13-day outlook)
- Expected Range: $10.30 to $11.65 (width $1.35, ≈12.0% of current price)
- Key Levels: Support at $10.86, Resistance at $11.58
Self-check: $11.65 − $10.30 = $1.35, and $1.35 / $11.245 ≈ 12.0%, which fits the 14–21 day guidance and is wider than any 2–3 day range. The target is below the current price, consistent with a bearish bias.
OVERALL BIAS
OVERALL BIAS: BEARISH - ADX is 28 and rising with −DI far above +DI, price is below all key moving averages (EMA10/20, SMA50D/200D, with a death cross in place), and the MACD and EMA crossovers are bearish. The oversold bounce has not reclaimed the EMA20, so a retest of the $10.86 low is more likely than a trend reversal.
This is educational analysis and not financial advice.