RGTI 20-day bearish forecast — Nov 1, 2026
- Bias: Bearish
- Timeframe: 20 days (made Nov 1, 2026, target date Nov 20, 2026)
- Price at analysis: $11.25
- Price target: $10.70
- Expected range: $10.05 – $11.40
- Result: Pending — graded after the close on Nov 20, 2026
Get a free AI analysis of RGTI today
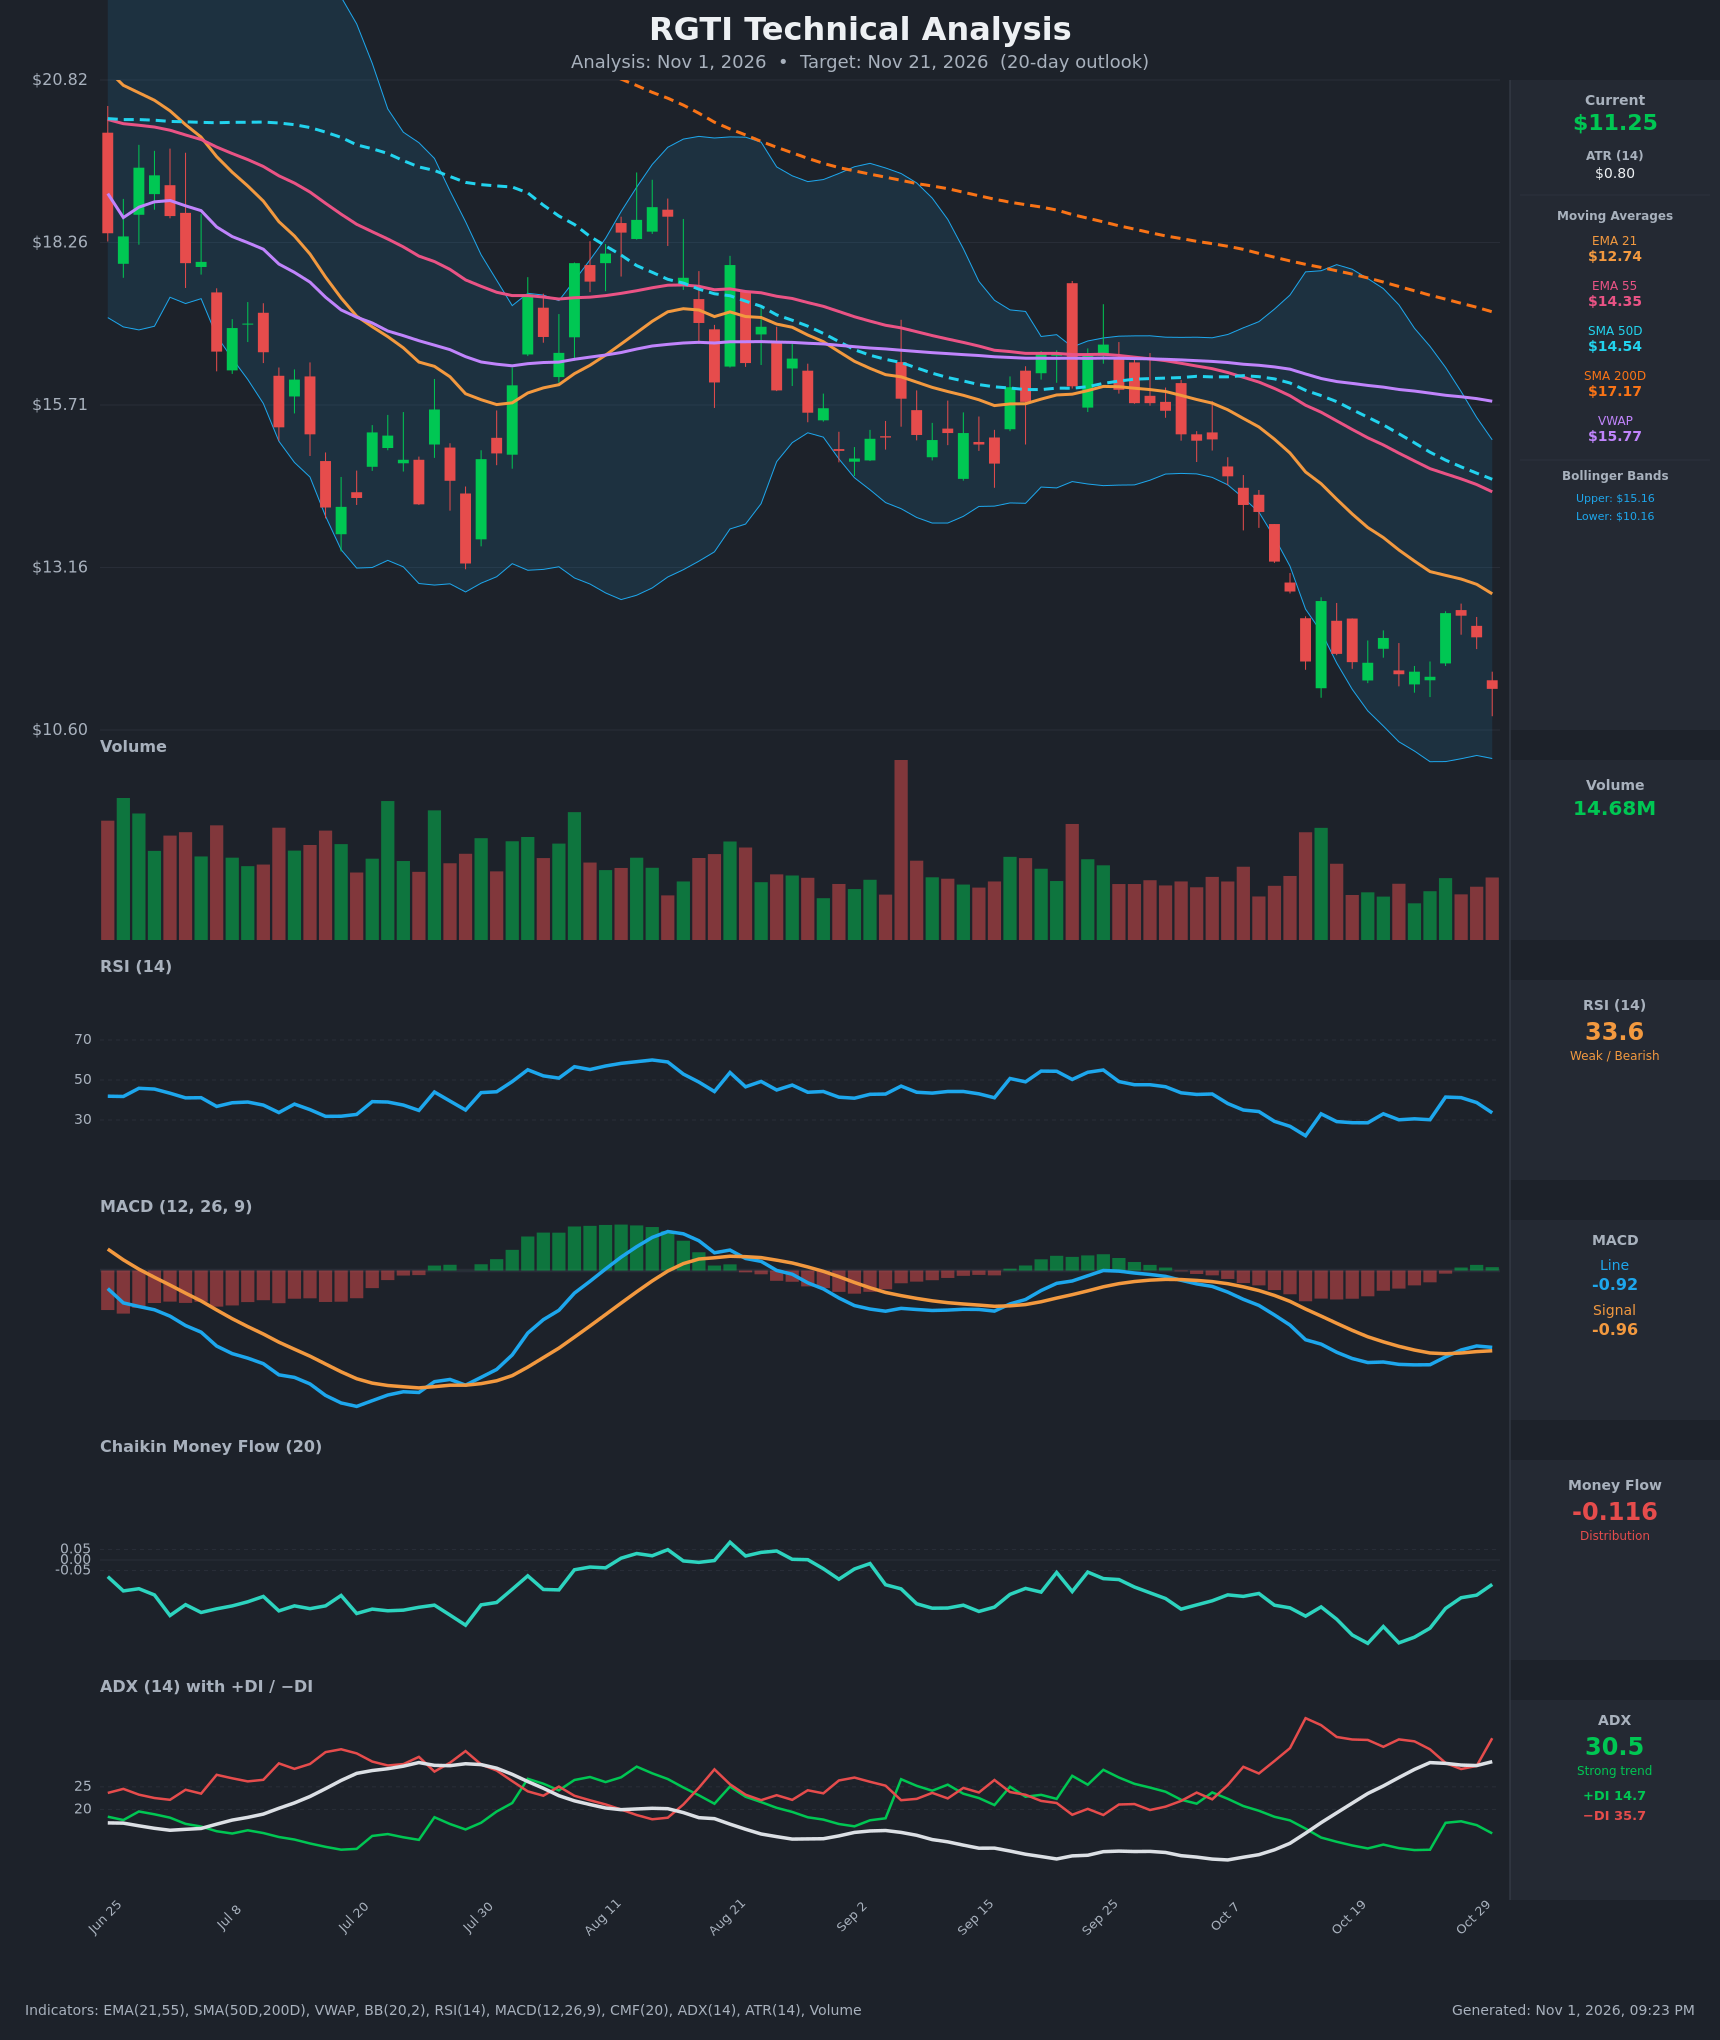
Analysis
TECHNICAL INDICATORS
- RSI (14): 33.58, down from 41.5 on Oct 27. It is near but not at oversold (<30). It has made lower highs through the whole decline, with only brief dips under 30 on Oct 14 to Oct 26. Momentum is weak with room to fall further. [Bearish]
- 20 EMA: The 21 EMA is $12.74 and price at $11.25 is about 12% below it, so it acts as overhead resistance. It is still sloping down, and it sits below the 55 EMA ($14.35), so the short-term trend is down. [Bearish]
- MACD: Line -0.917 is just above signal -0.957, a marginal positive histogram of about +0.04. The line crossed the signal on Oct 28, but both remain deep below zero. The crossover is weak and is flattening as price makes new lows. [Neutral]
- Bollinger Bands (20): Upper $15.16, lower $10.16, with price at $11.25 in the lower third. The bands are wide and sloping down, and price is walking the lower half after a recent excursion near the lower band. The $10.16 lower band is the next downside magnet. [Bearish]
- CMF (20): -0.116, below the -0.05 threshold. It recovered from about -0.39 but is still negative, and it has been below zero for most of the period. This signals distribution. [Distribution]
- ADX (14): 30.5 and rising, with -DI 35.7 well above +DI 14.7. A -DI spike on the last bar confirms bears are in control. This is a strong, established downtrend. [Strong Trend – Bearish]
- Volume: 14.68M on the latest red candle. That is average to slightly below average, with the heaviest volume in the recent selloff on the down days around Oct 14 to Oct 16. The latest breakdown has no capitulation volume, so it is not an exhaustion signal. [Neutral-to-Bearish]
DIVERGENCES & TRENDS
- Moving averages: Price ($11.25) is below the 21 EMA ($12.74), 55 EMA ($14.35), SMA50 ($14.54), VWAP ($15.77) and SMA200 ($17.17). The SMA50 is already below the SMA200 (death cross in place), and the EMA21 is below the EMA55. This is a full bearish stack.
- MACD vs. price: There is no clean bullish divergence. MACD has bounced from -1.126 to -0.917, but price made a lower close ($11.25 vs. $11.44 on Oct 26). This is a mild momentum improvement, not a reversal signal.
- RSI: It bounced to 41 on the Oct 27 rally and has already rolled over to 33.6. It was rejected well below 50, which is typical of a bear market.
- CMF: It improved from -0.39 to -0.12 but remains negative. Buying pressure is not strong enough to turn the trend.
- ADX/DI: ADX has climbed from 11 to 30.5 over the last 15 bars, and -DI is re-expanding. Trend strength is increasing in the bearish direction.
- Price action: The last candle broke below the Oct 15 to Oct 29 consolidation low (~$11.44), closing at $11.25 and making a new low.
CHART PATTERNS
- Bearish Flag / Rectangle (continuation): After the sharp drop from ~$14 to ~$11.5, price consolidated sideways between about $11.44 and $12.63 for roughly two weeks. The close at $11.25 breaks the base of that range, which matches the bearish flag/pennant continuation setup in the reference diagram.
- Measured move: The flagpole is about $2.5 to $3, which implies a very extended target in the $8.50 to $9 area. The nearer, more realistic target for 20 days is the lower Bollinger Band (~$10.16) and a possible overshoot toward $10.
- Longer-term: Lower highs and lower lows since June, with price pinned beneath the declining SMA200, form a broad descending channel. The structure is bearish.
POTENTIAL SCENARIOS
- Scenario 1: Bearish Flag Breakdown Continuation — Price confirms the break below $11.44 and the strong ADX/−DI trend drives it toward the lower Bollinger Band. Trigger: daily close below $11.20 with volume above 15M. Target: $10.70, then $10.16 (lower BB), with extension toward $9.80. Invalidation: daily close above $12.45 (top of recent range). (55% probability)
- Scenario 2: Neutral Range Chop / Basing — Price stalls near the lower Bollinger Band, RSI hovers near 30 to 40, and the shallow MACD cross keeps it bouncing between $10.30 and $12.30. Trigger: failure to break below $10.60 followed by closes back above $11.60. Target: $11.00 to $12.00. Invalidation: close below $10.16 or above $12.74. (20% probability)
- Scenario 3: Bullish Oversold Relief Bounce — A short-covering bounce in an oversold, high-beta stock, helped by the MACD bullish cross and RSI mean reversion. Trigger: reclaim of $12.45 on rising volume. Target: $12.74 (EMA21), then $13.50 (SMA/EMA resistance zone). Invalidation: rejection at $12.74 and a close back below $11.25. (25% probability)
PRICE TARGETS
Timeframe: 20 days (Nov 21, 2026), range scaled to ~12% of the current price. Self-check: range width is $11.40 − $10.05 = $1.35, or 12.0% of $11.25, which is in line with the 14-21 day guidance and wider than a 2-3 day range. The target is below the current price, consistent with a bearish bias.
- Target Price: $10.70
- Expected Range: $10.05 to $11.40
- Key Levels: Support at $10.16, Resistance at $12.74
OVERALL BIAS
OVERALL BIAS: BEARISH - Price has broken below its two-week consolidation (a bearish flag) beneath every key moving average. ADX is above 30 and rising with −DI far above +DI, and CMF shows distribution. The only offset is a weak MACD cross, which is not enough to counter the trend, so the lower Bollinger Band near $10.16 is the logical objective.
This is educational analysis and not financial advice.