RGTI 27-day bearish forecast — Nov 1, 2026
- Bias: Bearish
- Timeframe: 27 days (made Nov 1, 2026, target date Nov 27, 2026)
- Price at analysis: $11.25
- Price target: $10.30
- Expected range: $8.90 – $12.60
- Result: Pending — graded after the close on Nov 27, 2026
Get a free AI analysis of RGTI today
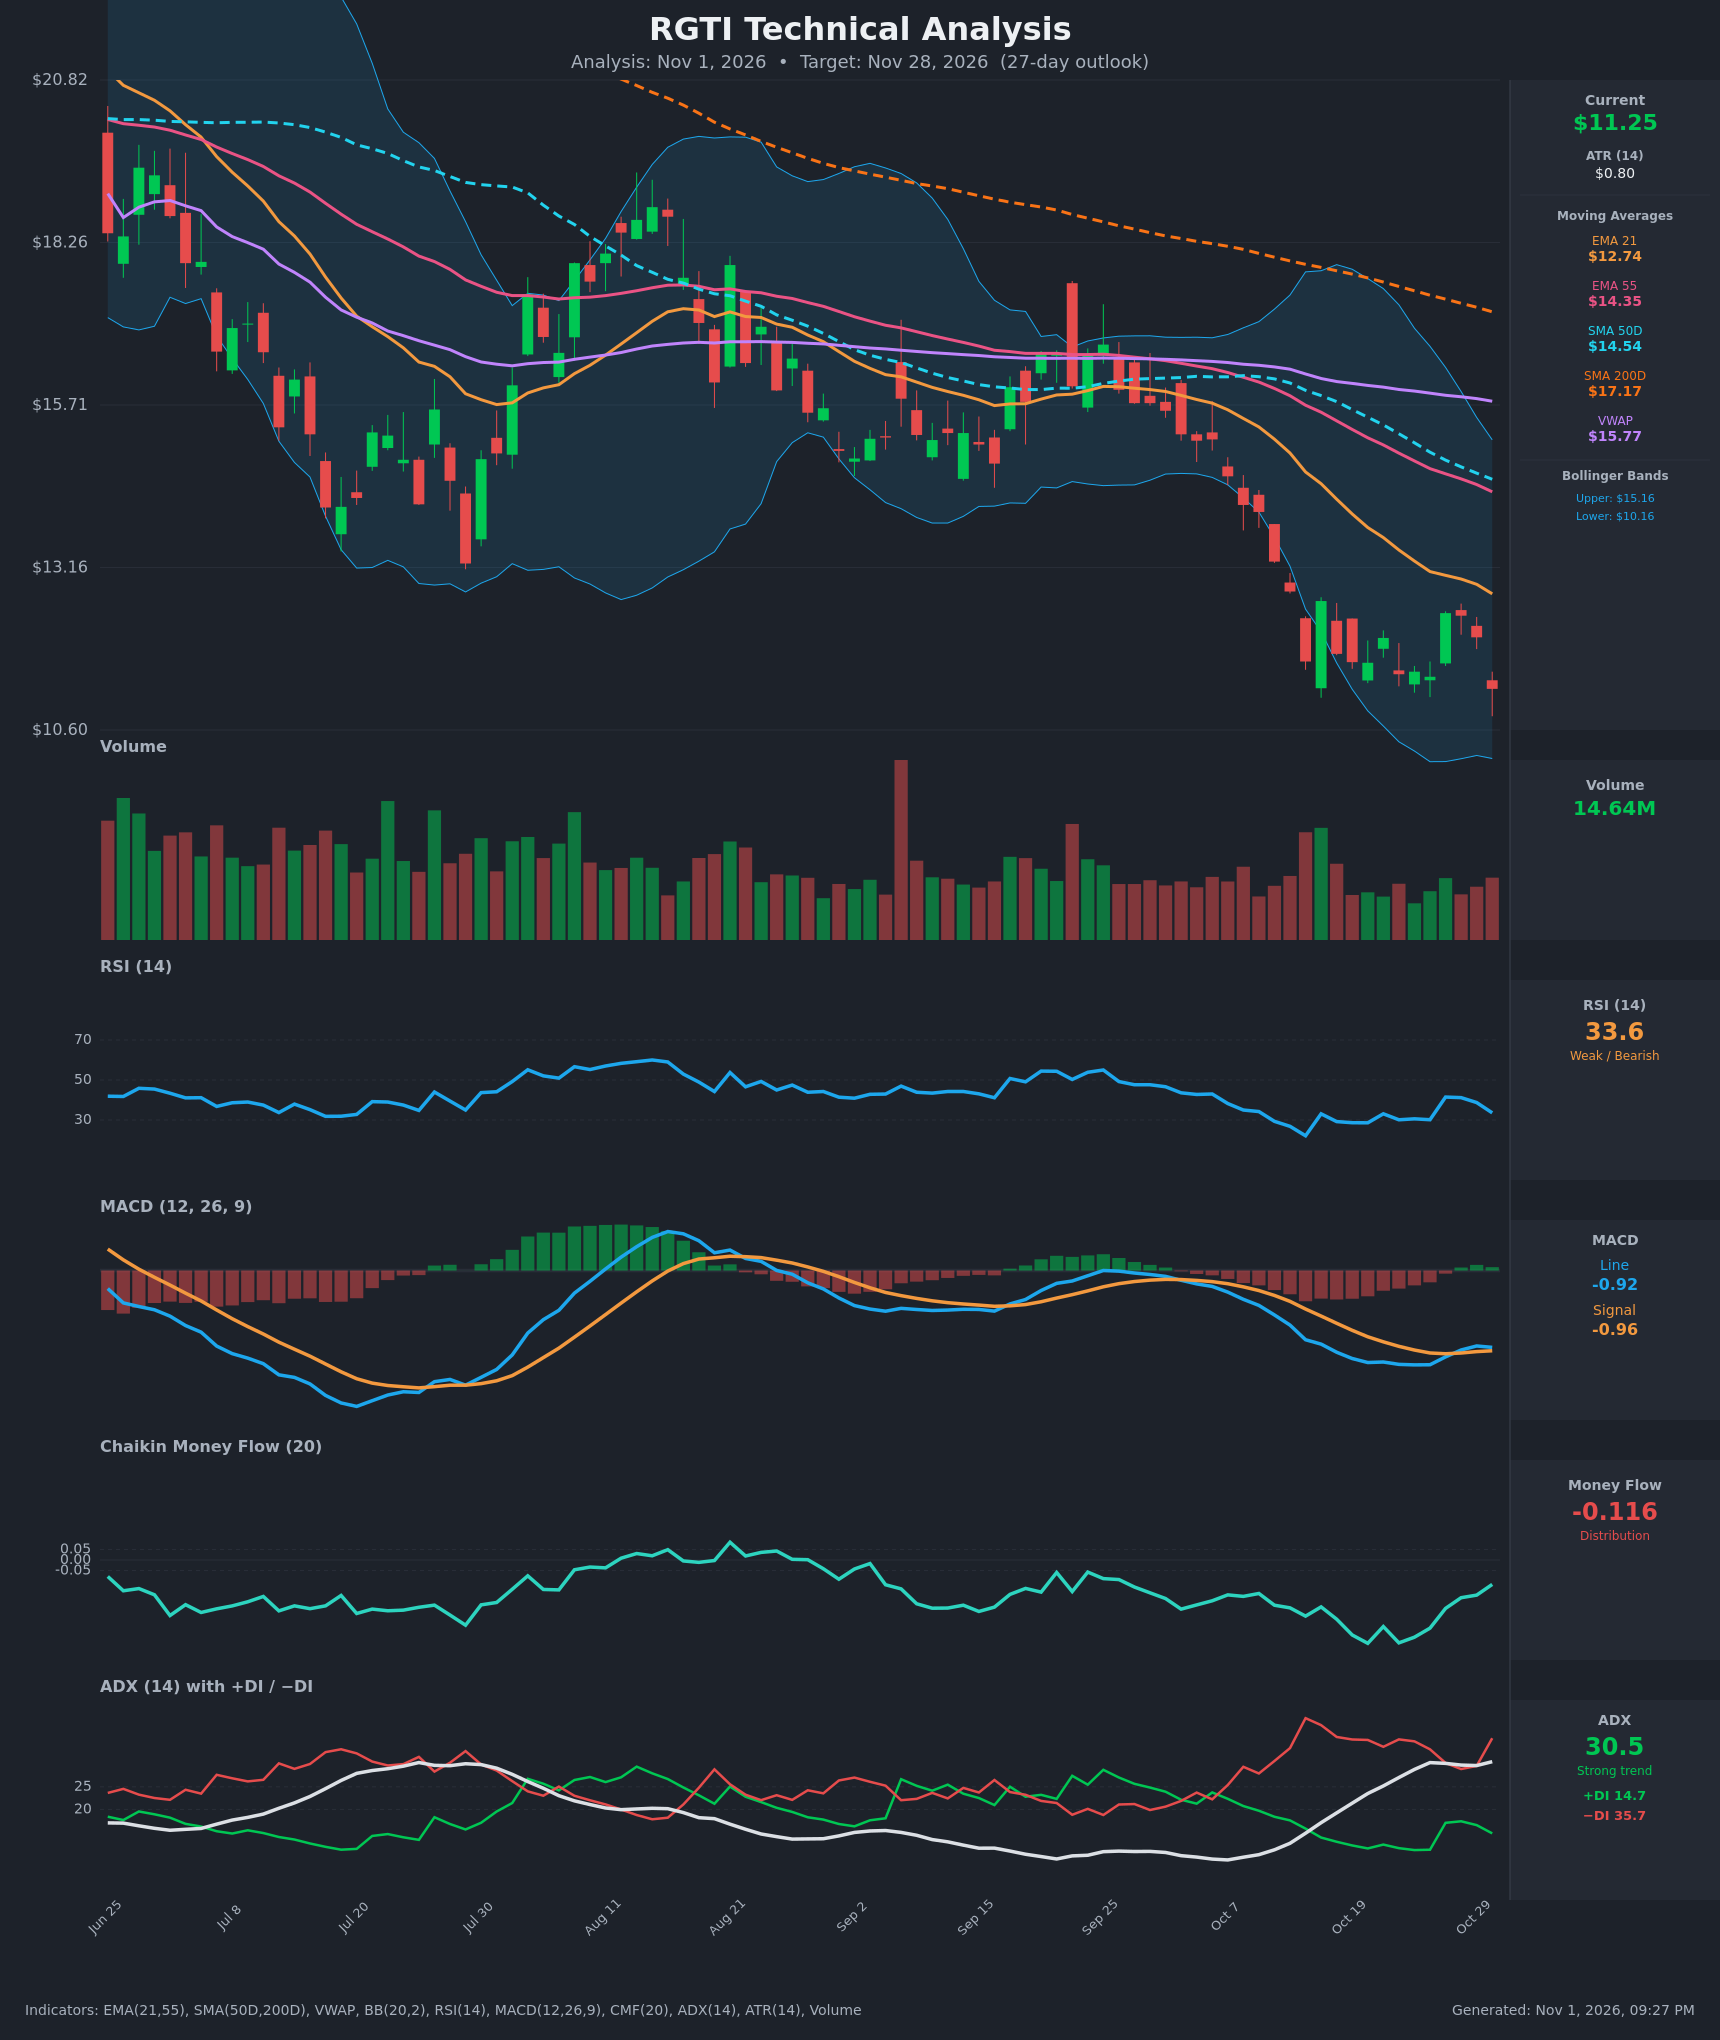
Analysis
TECHNICAL INDICATORS
- RSI (14): 33.58, down from 41.5 on Oct 27 and close to oversold (<30) without reaching it. It has held a 29-33 range for most of the last two weeks, so momentum is weak but not yet washed out. [Bearish]
- 20 EMA: The EMA 21 is $12.74 and price at $11.25 is about 12% below it. The EMA 21 is also below the EMA 55 ($14.35), so the short-term average is acting as resistance and sloping down. [Bearish]
- MACD: Line -0.917 vs. signal -0.957 gives a marginal positive histogram of about +0.04. The line crossed above the signal around Oct 28-29, but both sit deep in negative territory and the line is turning back down (-0.900 to -0.917). This is a weak, fragile bullish crossover that is likely to fail without a price bounce. [Neutral]
- Bollinger Bands (20): Upper $15.16, lower $10.16, midline about $12.66. Price sits in the lower quarter of the bands, about $1.10 above the lower band, with the bands still wide. Price has been walking the lower half since mid-October, which suggests a persistent downtrend rather than a squeeze. [Bearish]
- CMF (20): -0.116, below the -0.05 threshold. It improved from -0.395 on Oct 20 but has stayed negative, and it ticked back down on the latest drop. Selling pressure still dominates. [Distribution]
- ADX (14): 30.5 and rising from 11 two weeks ago, with −DI 35.7 well above +DI 14.7. The trend is strong and firmly bearish, and the DI spread is widening again on the last bar. [Strong Trend – Bearish]
- Volume: 14.64M, about average and below the spikes seen on the mid-October breakdown. The bounce on Oct 27 came on modest volume, and the red candle on Oct 30 gives it back, so there is no capitulation volume signalling a bottom. [Neutral to Bearish – no capitulation]
DIVERGENCES & TRENDS
- Moving average structure: Price ($11.25) < EMA21 ($12.74) < EMA55 ($14.35) < SMA50D ($14.54) < SMA200D ($17.17), with VWAP at $15.77 far overhead. This is a fully bearish stack. Every average is falling and the SMA50D is accelerating down toward the EMA 55. The SMA50D is already below the SMA200D (death cross in place).
- No bullish RSI divergence yet: Price made a lower low (~$11.25) versus Oct 26 ($11.44), while RSI at 33.6 is above its Oct 20-26 lows (28.6-30.1). This is a mild hint of momentum divergence, but RSI has not made a clean higher low in an oversold zone, so it is not confirmed.
- MACD: The tiny bullish crossover is already flattening. A new lower low in price would likely roll it back over.
- ADX/DI: The −DI spike back to 35.7 with ADX at a 30+ high confirms the downtrend is re-accelerating after the Oct 27 bounce failed.
- Rejection: The bounce stalled at $12.44 below the falling EMA21, a classic sell-the-rally behavior in a downtrend.
CHART PATTERNS
- Bearish Flag / Pennant (continuation): After the sharp drop from ~$15 to ~$11.5 in early-mid October, price has chopped sideways in a roughly $11.4-$12.4 range with slight upward drift. This matches the Bearish Flag/Pennant continuation structure in the reference. The measured move equals the prior leg (~$3-3.5 pole) projected from the breakdown near $11.40, giving a theoretical target around $8.00-$8.50.
- Broader context: The whole chart is a series of lower highs and lower lows from ~$20 (a descending channel). This resembles a larger Descending Triangle/Channel, with horizontal-ish support near $11.40 now being tested a third time. Repeated tests of support tend to weaken it.
- Caution: The lower Bollinger Band ($10.16) and the next visible low area (~$10.60) provide nearby support, and RSI near 30 raises the odds of a relief bounce. Any rally should face resistance at $12.44 and the EMA21 near $12.74.
POTENTIAL SCENARIOS
- Scenario 1: Bearish Flag Breakdown Continuation — Price loses the $11.25-$11.40 support cluster and continues the established downtrend, with ADX above 30 and −DI dominant. Trigger: daily close below $11.25 / $11.00. Target: $9.50-$10.00 (lower Bollinger Band zone, then the measured-move extension). Invalidation: daily close above $12.75 (EMA21). (55% probability)
- Scenario 2: Neutral Range-Bound Base — Price consolidates between roughly $10.30 and $12.50 as RSI cools and sellers exhaust. Trigger: holding $10.50-$11.00 on declining volume. Target: $11.00-$12.00. Invalidation: close below $10.20 or above $12.80. (15% probability)
- Scenario 3: Bullish Oversold Relief Rally — RSI near 30, CMF improvement, and the small MACD crossover spark a mean-reversion bounce toward the EMA21 and middle of the Bollinger Bands. Trigger: close above $12.44 on rising volume. Target: $13.00-$13.50 (EMA21 and mid-band). Invalidation: close back below $11.25. (30% probability)
PRICE TARGETS
Timeframe: 27 days (Nov 28, 2026). ATR $0.80, so the 27-day range is wide, about 15% of the current price.
- Target Price: $10.30
- Expected Range: $8.90 to $12.60 (width $3.70 = about 33%, wider than the 12-18% guideline because of RGTI's high volatility and the fact that a flag-breakdown target sits well below the lower band; the range is roughly consistent with a ~4.6 ATR move either way)
- Key Levels: Support at $10.16 (lower Bollinger Band), Resistance at $12.74 (EMA 21)
OVERALL BIAS
OVERALL BIAS: BEARISH - A fully bearish moving-average stack with an established death cross, ADX above 30 with −DI at 35.7 vs. +DI at 14.7, persistent CMF distribution, and a bearish flag consolidation just above support favor continuation lower. The fragile MACD crossover and RSI near 30 allow for relief bounces, but sellers hold control below the $12.74 EMA 21.
This is educational analysis and not financial advice.