RGTI 34-day bearish forecast — Nov 1, 2026
- Bias: Bearish
- Timeframe: 34 days (made Nov 1, 2026, target date Dec 4, 2026)
- Price at analysis: $11.25
- Price target: $10.40
- Expected range: $9.50 – $11.50
- Result: Pending — graded after the close on Dec 4, 2026
Get a free AI analysis of RGTI today
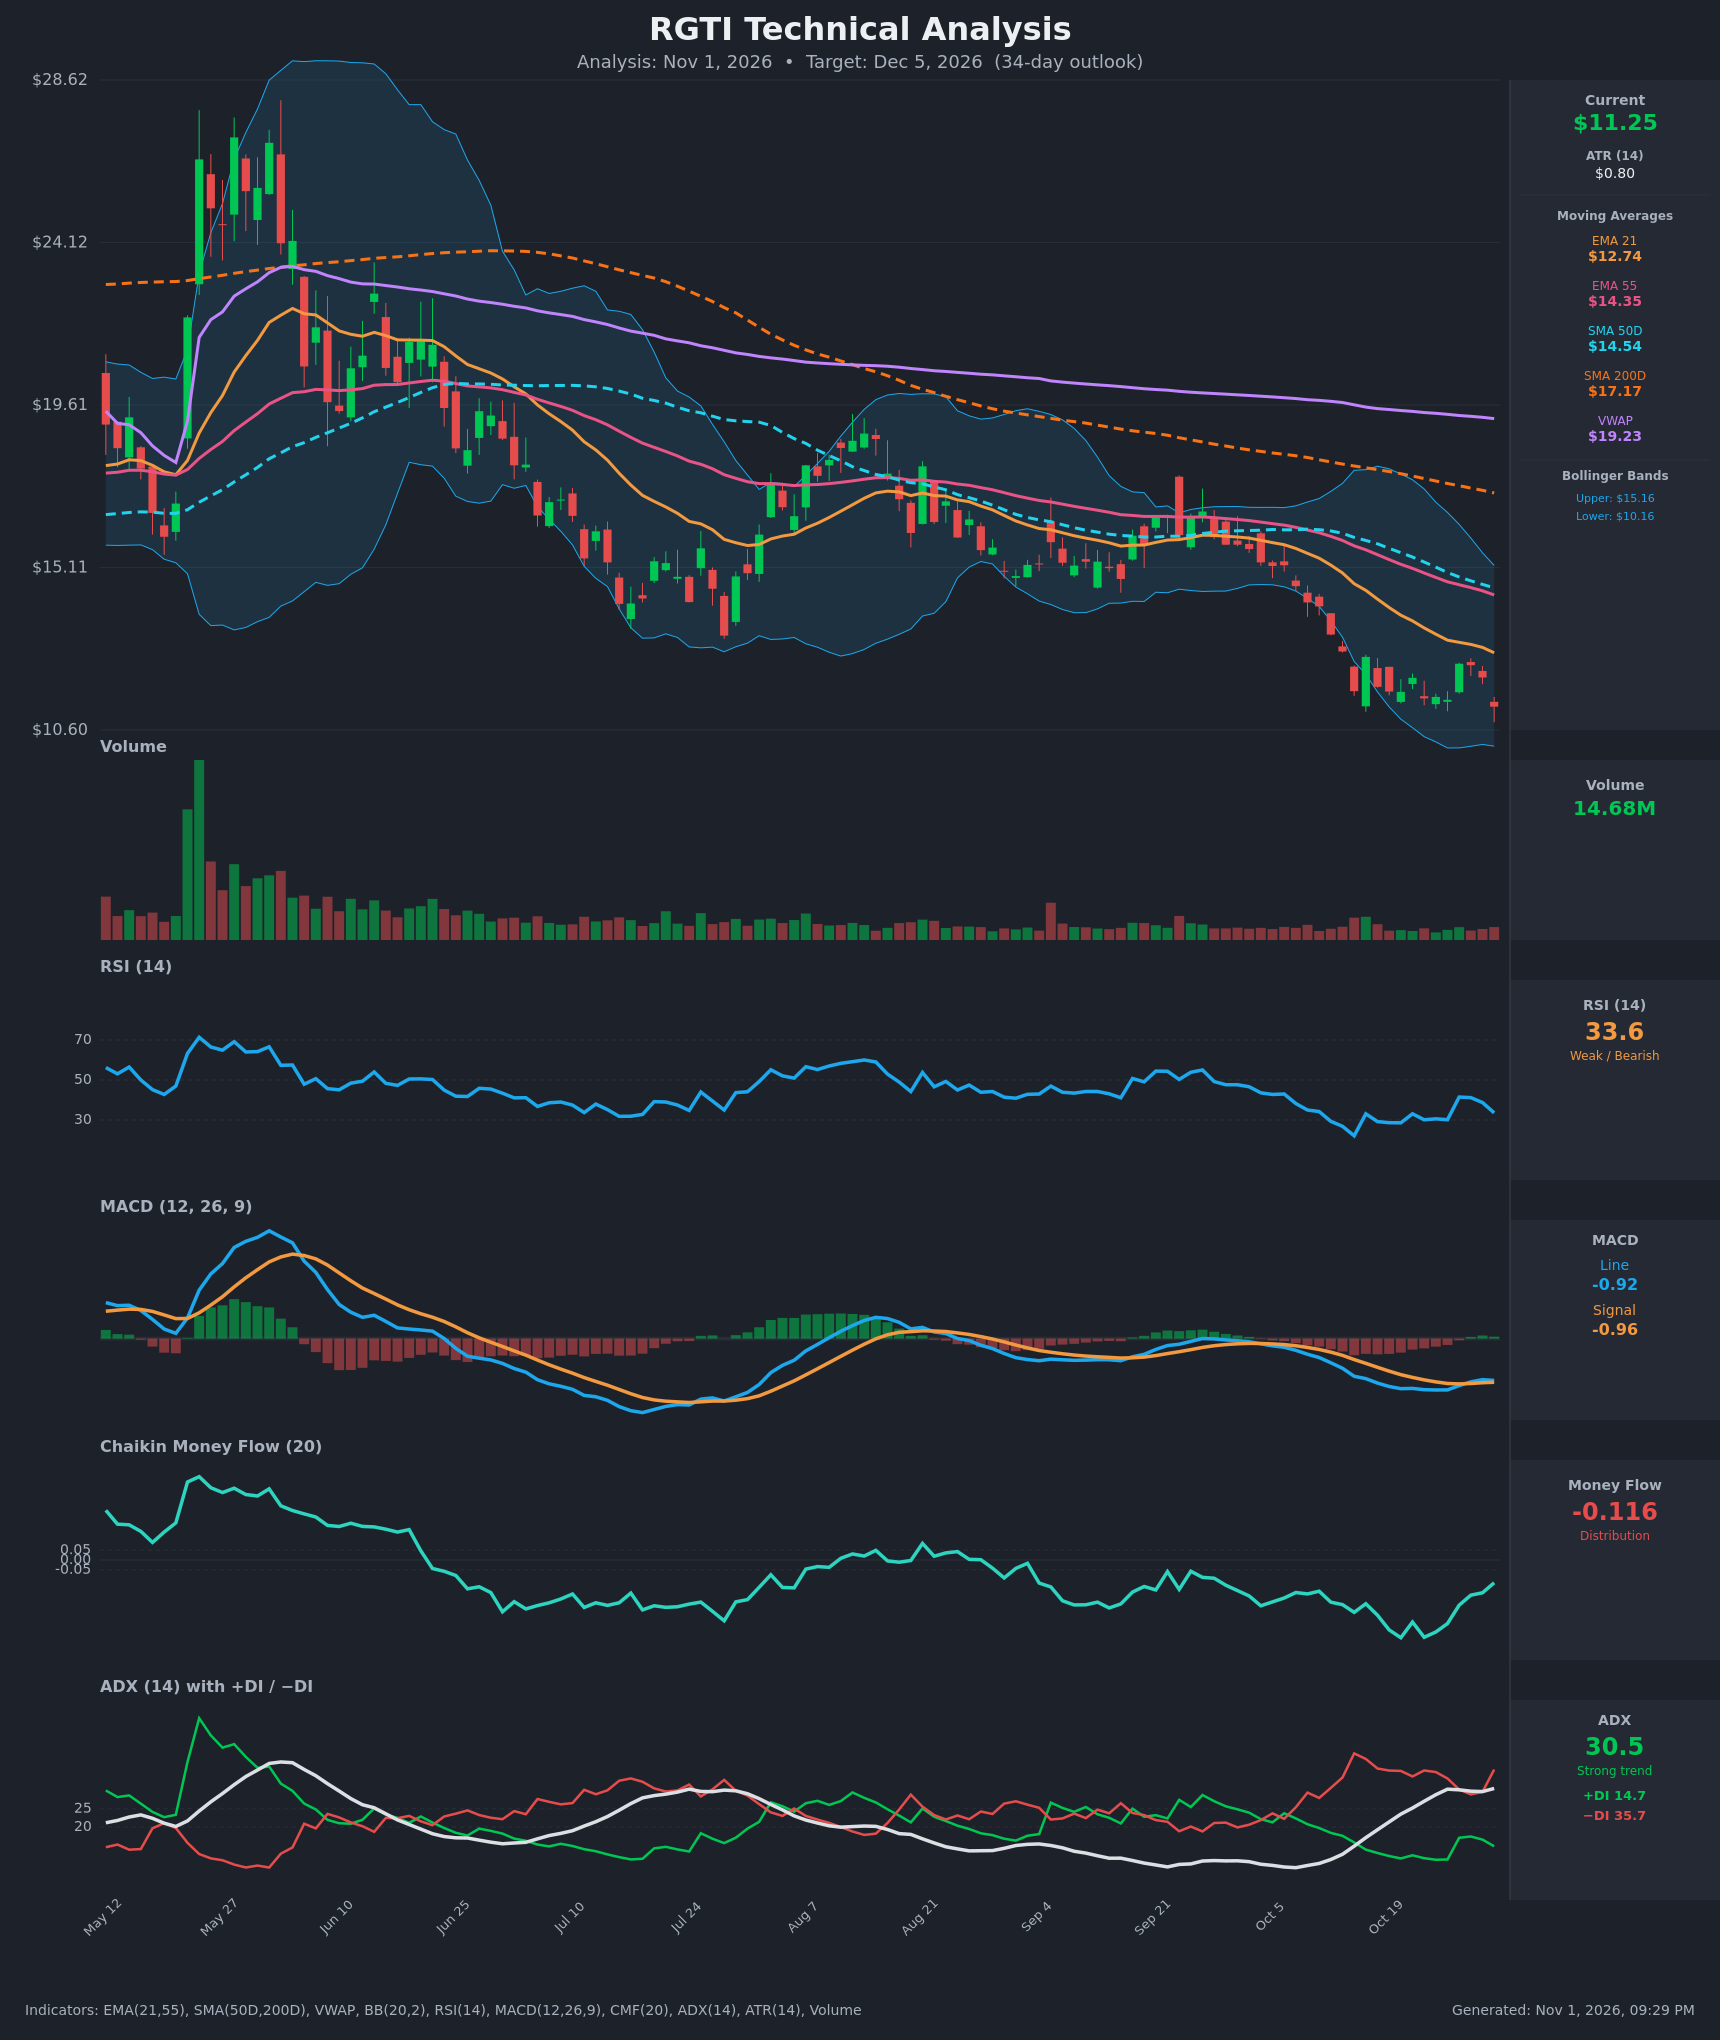
Analysis
TECHNICAL INDICATORS
- RSI (14): 33.58, down from 41.5 on Oct 27 and near the oversold line. Price is at a new closing low while RSI sits well above its Oct 14 low of 22.1, which is a mild bullish divergence. Momentum is still weak and falling. [Bearish]
- 20 EMA: The EMA 21 is $12.74 and price at $11.25 is about 12% below it. The EMA 21 is below the EMA 55 ($14.35), SMA50D ($14.54) and SMA200D ($17.17), a fully bearish stack that acts as overhead resistance. [Bearish]
- MACD: Line -0.917 is just above signal -0.957, a histogram of about +0.04. The line crossed above the signal on Oct 28 but is now rolling back toward it (-0.900 to -0.917). It is deeply negative, and the bullish cross is weak and fading. [Bearish]
- Bollinger Bands (20): Upper $15.16, lower $10.16, with price in the lower third. The bands are expanding downward with the middle band (about $12.66) falling. Price has not touched the lower band, so there is room to run, though a bounce toward the mid-band is possible. [Bearish]
- CMF (20): -0.116 is below -0.05, so distribution. It has improved from -0.395 on Oct 20, which shows selling pressure easing, but it is still negative. [Distribution]
- ADX (14): 30.5 and rising from 11 two weeks ago. −DI (35.7) is far above +DI (14.7), so bears are firmly in control. [Strong Trend – Bearish]
- Volume: 14.68M, in line with recent levels and well below the spike near the highs. Red candles have carried slightly more volume than green ones on the recent decline, with no capitulation spike. [Neutral to Bearish: no capitulation yet]
DIVERGENCES & TRENDS
- RSI divergence: Price made a new closing low ($11.25 vs $11.68 on Oct 14) while RSI is at 33.6 vs 22.1. This is a bullish divergence, but it is mild and only warns of a relief bounce.
- CMF improvement: CMF has risen from -0.395 to -0.116 while price stayed flat or lower. Selling is moderating but accumulation has not appeared.
- Moving averages: The SMA50D ($14.54) is well below the SMA200D ($17.17), so the death cross is already in place. Price is below every moving average and VWAP ($19.23), which confirms a long-term downtrend.
- EMA structure: EMA21 is below EMA55 and the gap is widening (about $1.60).
- MACD: The bullish cross on Oct 28 is losing steam. A move back below the signal line would renew the bearish momentum signal.
- ADX/DI: −DI has been above +DI throughout. ADX has risen above 25 with −DI re-expanding (30.3 to 35.7 in three days). This is a classic established downtrend.
- Price action: The stock failed at $12.44 on Oct 27 and fell back to $11.25, forming a lower high. Peaks have been lower since the Sep 21 rally.
CHART PATTERNS
- Bearish Flag / Descending Channel (Continuation): After the sharp drop from about $16 to $11.7, price consolidated in a narrow $11.4–$12.4 range. The slide back to $11.25 resembles a bearish flag failing. Its measured move points to roughly $9.50–$10.20, and the lower Bollinger Band at $10.16 is the first stop.
- Lower highs and lower lows: This is the textbook down-trending structure, with rallies repeatedly rejected at falling EMAs.
- Watch item, Bullish Falling Wedge: The RSI and CMF divergences could build into a falling-wedge or double-bottom reversal. That would be confirmed only by a close above $12.74 (EMA21) and a MACD move above zero. It is not confirmed now.
POTENTIAL SCENARIOS
- Scenario 1: Bearish Flag Breakdown Continuation — Price loses the $11.25–$11.40 area and the downtrend continues, led by −DI dominance, a negative CMF and a bearish MA stack. Trigger: daily close below $11.00 with a MACD re-cross below signal. Target: $10.16 (lower BB), then $9.50–$9.80. Invalidation: daily close above $12.74 (EMA21). (50% probability)
- Scenario 2: Bullish Oversold Relief Bounce — The RSI and CMF divergences produce a mean-reversion rally into falling resistance. Trigger: close above $12.45 with rising volume and MACD histogram expansion. Target: $12.74 (EMA21), then $13.40–$14.35 (EMA55). Invalidation: failure at $12.74 or a close back below $11.00. (32% probability)
- Scenario 3: Neutral Basing Range — Price chops between $10.50 and $12.50 as selling exhausts, with ADX rolling over. Trigger: holds above $10.16 with no close above $12.74. Target: $11.00–$12.00. Invalidation: close outside $10.16–$12.74. (18% probability)
PRICE TARGETS
- Target Price: $10.40 (34-day)
- Expected Range: $9.50 to $11.50 (width $2.00, about 17.8% of current price, consistent with the 30–60 day guidance)
- Key Levels: Support at $10.16, Resistance at $12.74
OVERALL BIAS
OVERALL BIAS: BEARISH - Price is below every moving average and VWAP, the death cross is in place, ADX is above 30 with −DI far above +DI, and CMF shows distribution. The RSI and CMF divergences point to a possible relief bounce, but until price reclaims the $12.74 EMA21 the path of least resistance is lower, toward $10.16 and the low $10s.
This is educational analysis and not financial advice.