RGTI 48-day bearish forecast — Nov 1, 2026
- Bias: Bearish
- Timeframe: 48 days (made Nov 1, 2026, target date Dec 18, 2026)
- Price at analysis: $11.25
- Price target: $10.40
- Expected range: $9.50 – $11.50
- Result: Pending — graded after the close on Dec 18, 2026
Get a free AI analysis of RGTI today
Analysis
TECHNICAL INDICATORS
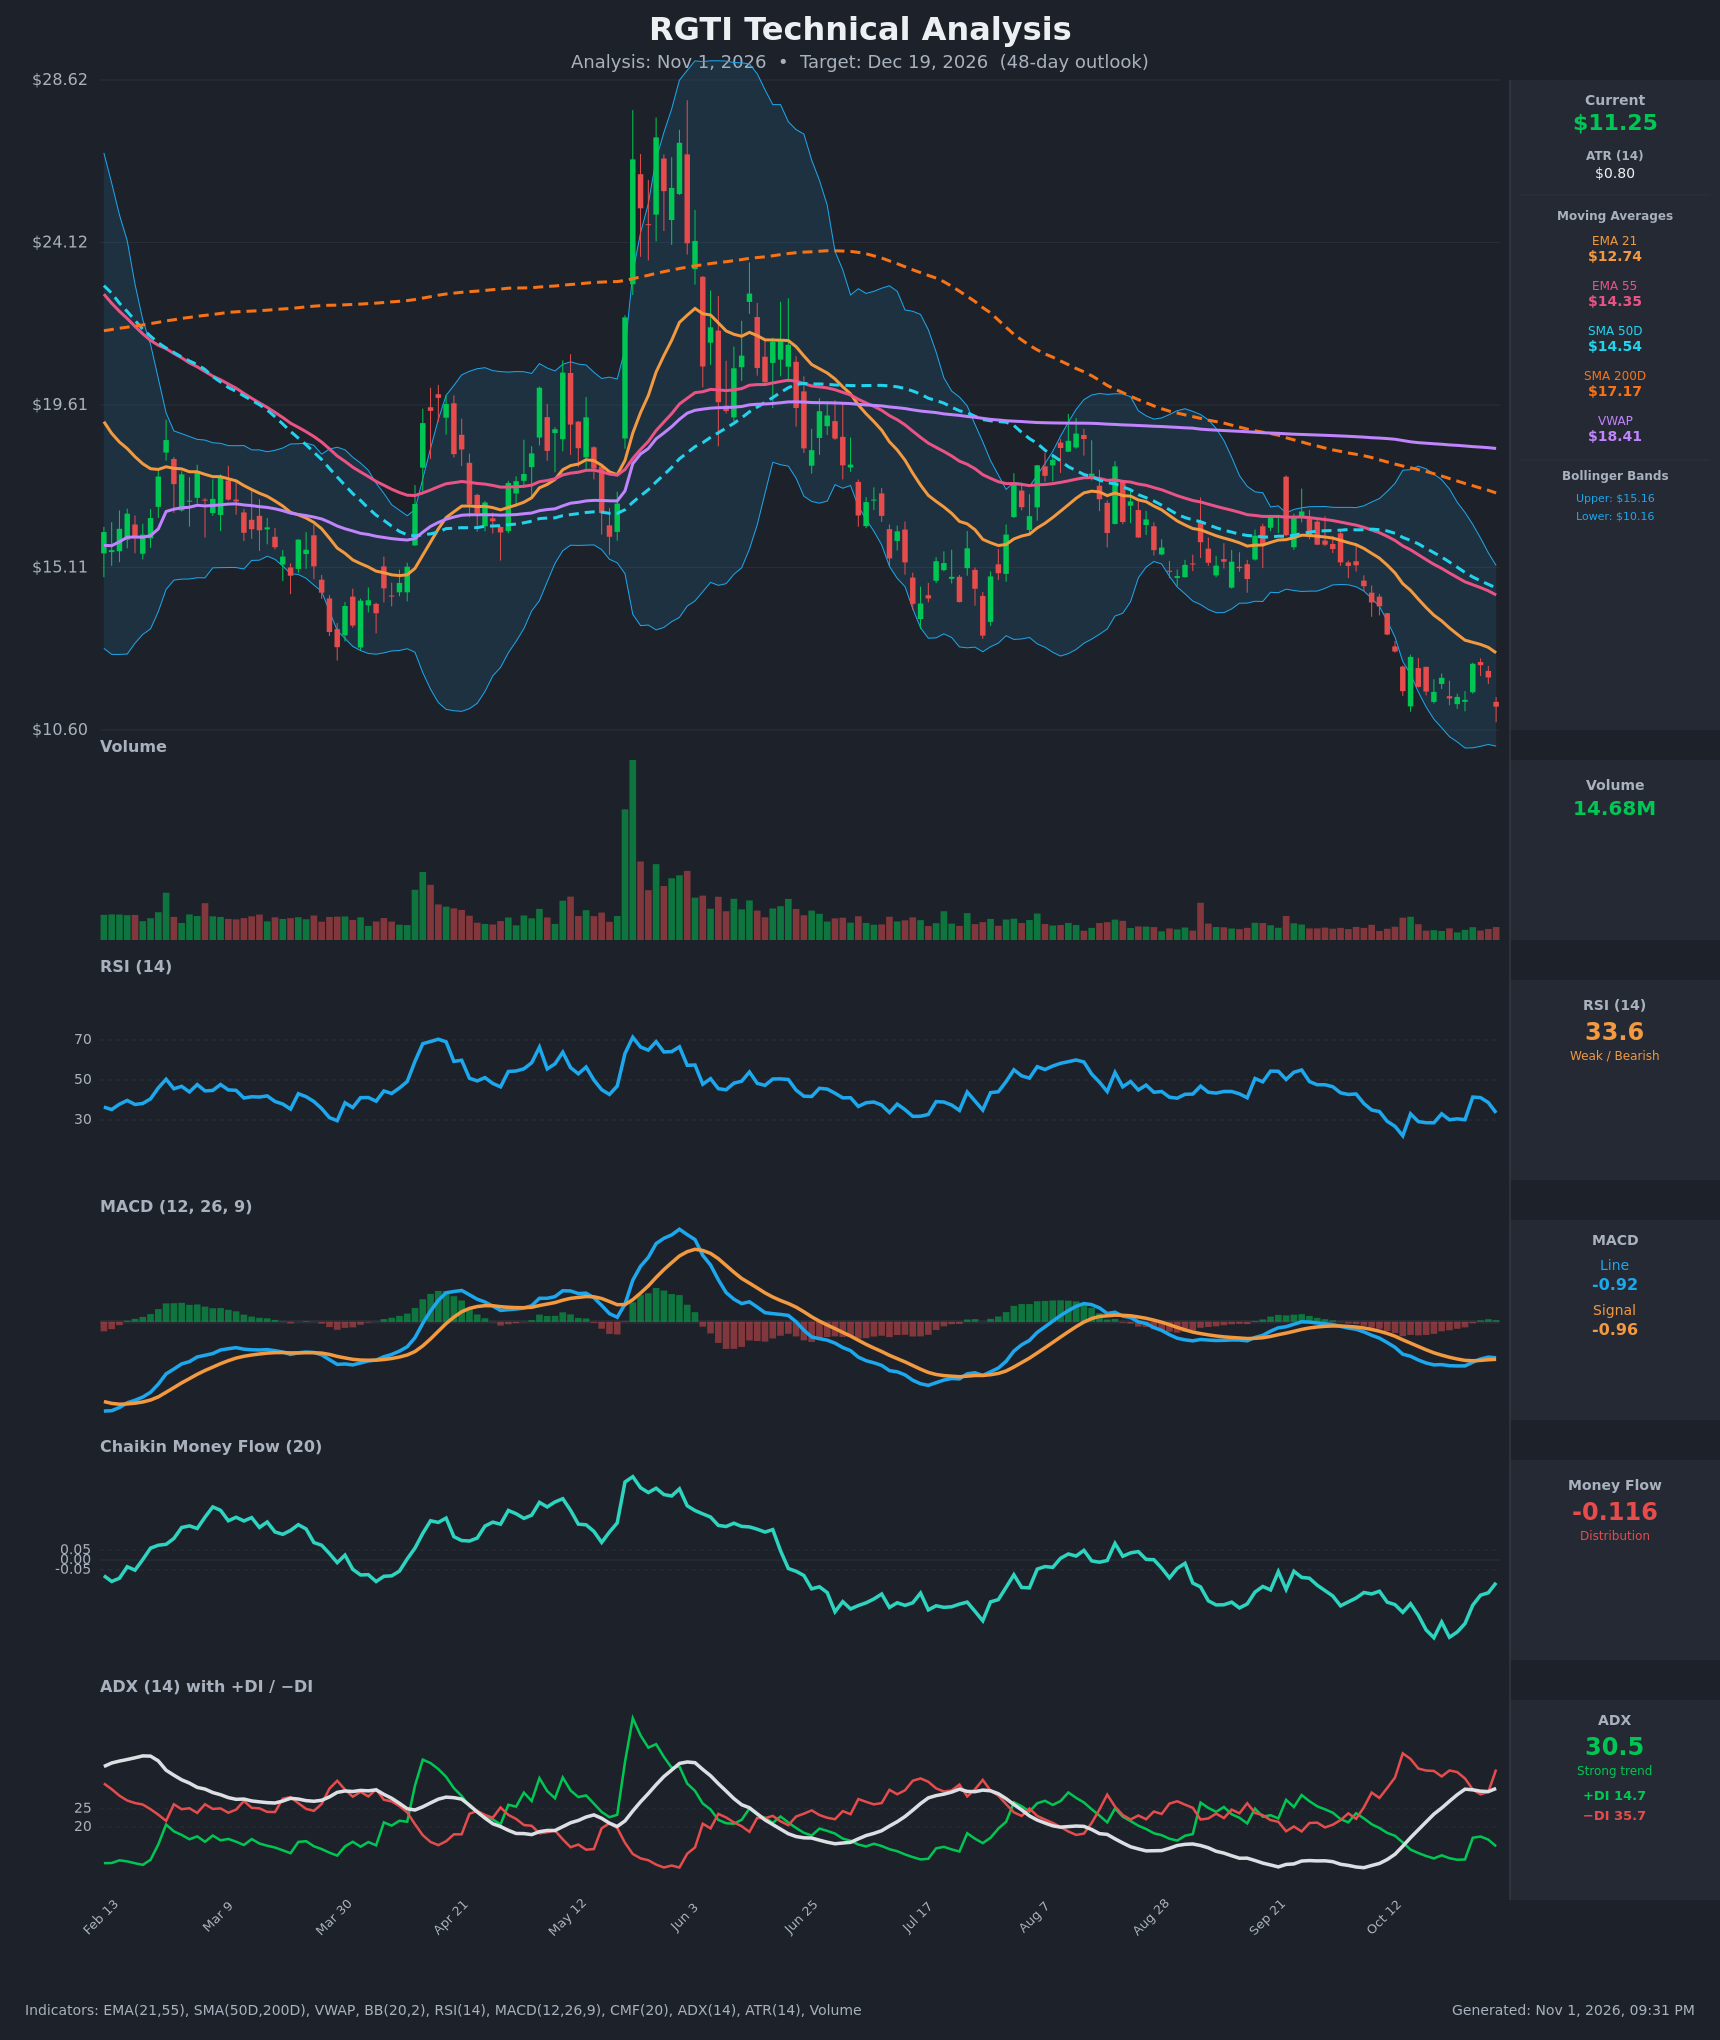
- RSI (14): 33.58, down from a bounce to 41.5 on Oct 27. It is near oversold but has not reached it. The Oct 14 low of 22.1 was the washout, and the lower highs since then show momentum still favors sellers. [Bearish]
- 20 EMA: The 21 EMA is $12.74, and price at $11.25 is about 12% below it. The EMA is sloping down and has been rejecting every bounce (the Oct 27-28 rally to $12.44 stalled right under it). It is acting as resistance. [Bearish]
- MACD: Line -0.917 versus signal -0.957, so the line sits just above the signal with a tiny positive histogram (+0.04). This is a marginal bullish crossover, but both lines are deep below zero and the line has started rolling over again (-0.900 to -0.917). It is a weak, unconfirmed signal. [Neutral]
- Bollinger Bands (20): Upper $15.16, lower $10.16, so price is in the lower quarter of the band. The bands have been contracting from a wide range, and price has been riding the lower half since mid-October. A walk down the lower band is typical of a downtrend, though a touch of $10.16 would be statistically stretched. [Bearish]
- CMF (20): -0.116, below the -0.05 threshold and negative for most of the past several months. It has improved from -0.395 but fell back on the latest red bar. This is persistent distribution. [Distribution]
- ADX (14): 30.5 and rising from 11 on Oct 12, with −DI at 35.7 far above +DI at 14.7. The trend is strong, and bears are firmly in control. [Strong Trend – Bearish]
- Volume: 14.68M, with volume fading across the recent small-bodied candles. It was heavy on the earlier selloff, and the latest decline is not backed by capitulation volume. That means no washout has marked a bottom yet. [Neutral to Mildly Bearish]
DIVERGENCES & TRENDS
- Death cross: SMA50D ($14.54) is already below SMA200D ($17.17), the long-term trend is down, and the gap between them is widening.
- MA stack: Price ($11.25) < EMA21 ($12.74) < EMA55 ($14.35) < SMA50D ($14.54) < SMA200D ($17.17) < VWAP ($18.41). This is a fully bearish alignment, and every average is sloping down.
- RSI: There is no bullish divergence. RSI made a lower low (22.1 on Oct 14) with price near $11.68, and the later price lows around $11.44 had RSI around 30. That is roughly in sync, so there is no clear reversal signal.
- MACD: The tiny positive histogram is a slight attempt at momentum stabilization, but the line is still far below zero and rolling over.
- CMF: It has been in distribution since June. It improved in late October but is turning back down.
- DI/ADX: The −DI dominance and rising ADX confirm a strengthening downtrend. +DI briefly rose to 17.4 on Oct 28 and failed.
- Candles: The last candle closed at $11.25, below the Oct 26 low of $11.44, which breaks the small consolidation floor.
CHART PATTERNS
- Bearish Flag / Pennant (continuation): After the sharp drop from about $16 to $11.5, price consolidated in a tight $11.4–$12.4 range. The latest close at $11.25 breaks below it, which matches the bearish flag/pennant breakdown in the reference diagram. The measured move from the flagpole is large, but a more conservative target is a push toward the lower Bollinger Band at $10.16 and the chart's low-end support near $10.60.
- Larger structure: The sequence of lower highs (about $28 → $17.5 → $16 → $13) is a long-term descending structure, so rallies are likely to be sold.
- Caveat: Price near the lower band with RSI in the low 30s raises the odds of a sharp oversold bounce, but any such bounce would be a relief rally into resistance unless the $12.74 area is reclaimed.
POTENTIAL SCENARIOS
- Scenario 1: Bearish Flag Breakdown Continuation — Price breaks below the $11.25–$11.44 consolidation floor and continues the downtrend, with −DI dominance and ADX above 30 sustaining momentum. Rallies fail at the falling 21 EMA. Trigger: daily close below $11.25 with expanding volume, followed by a break of $10.60. Target: $10.16 (lower BB), with an extension to about $9.50. Invalidation: daily close above $12.74 (21 EMA). (58% probability)
- Scenario 2: Bullish Oversold Relief Bounce — RSI near 30 and the marginal MACD cross spark a mean-reversion rally back to the declining moving averages. Trigger: reclaim of $12.44 (the Oct 27 high) on rising volume and a CMF move above -0.05. Target: $12.74–$13.50 (21 EMA and the zone below the 55 EMA). Invalidation: failure at $12.74 and a new low below $10.60. (27% probability)
- Scenario 3: Neutral Basing Range — Price stalls between $10.20 and $12.40 as selling exhausts without a reversal. Trigger: several closes inside the range and ADX rolling over from 30. Target: about $11.25. Invalidation: close outside $10.16–$12.74. (15% probability)
PRICE TARGETS
For a 48-day horizon, the range width is calculated as ($11.50 − $9.50) = $2.00, or about 17.8% of the current price, which is consistent with the 30–60 day guidance.
- Target Price: $10.40 (48-day)
- Expected Range: $9.50 to $11.50
- Key Levels: Support at $10.16 (lower Bollinger Band), Resistance at $12.74 (21 EMA)
OVERALL BIAS
OVERALL BIAS: BEARISH - The stock trades below every moving average with a death cross in place, −DI (35.7) is far above +DI (14.7) with ADX at 30.5, CMF shows distribution, and price has just broken below its consolidation (a bearish flag-type breakdown). The oversold RSI and marginal MACD cross make a relief bounce possible, but resistance at the $12.74 21 EMA should cap it.
This is educational analysis and not financial advice.