RGTI 62-day bearish forecast — Nov 1, 2026
- Bias: Bearish
- Timeframe: 62 days (made Nov 1, 2026, target date Jan 1, 2027)
- Price at analysis: $11.25
- Price target: $10.25
- Expected range: $8.25 – $13.75
- Result: Pending — graded after the close on Jan 1, 2027
Get a free AI analysis of RGTI today
Analysis
TECHNICAL INDICATORS
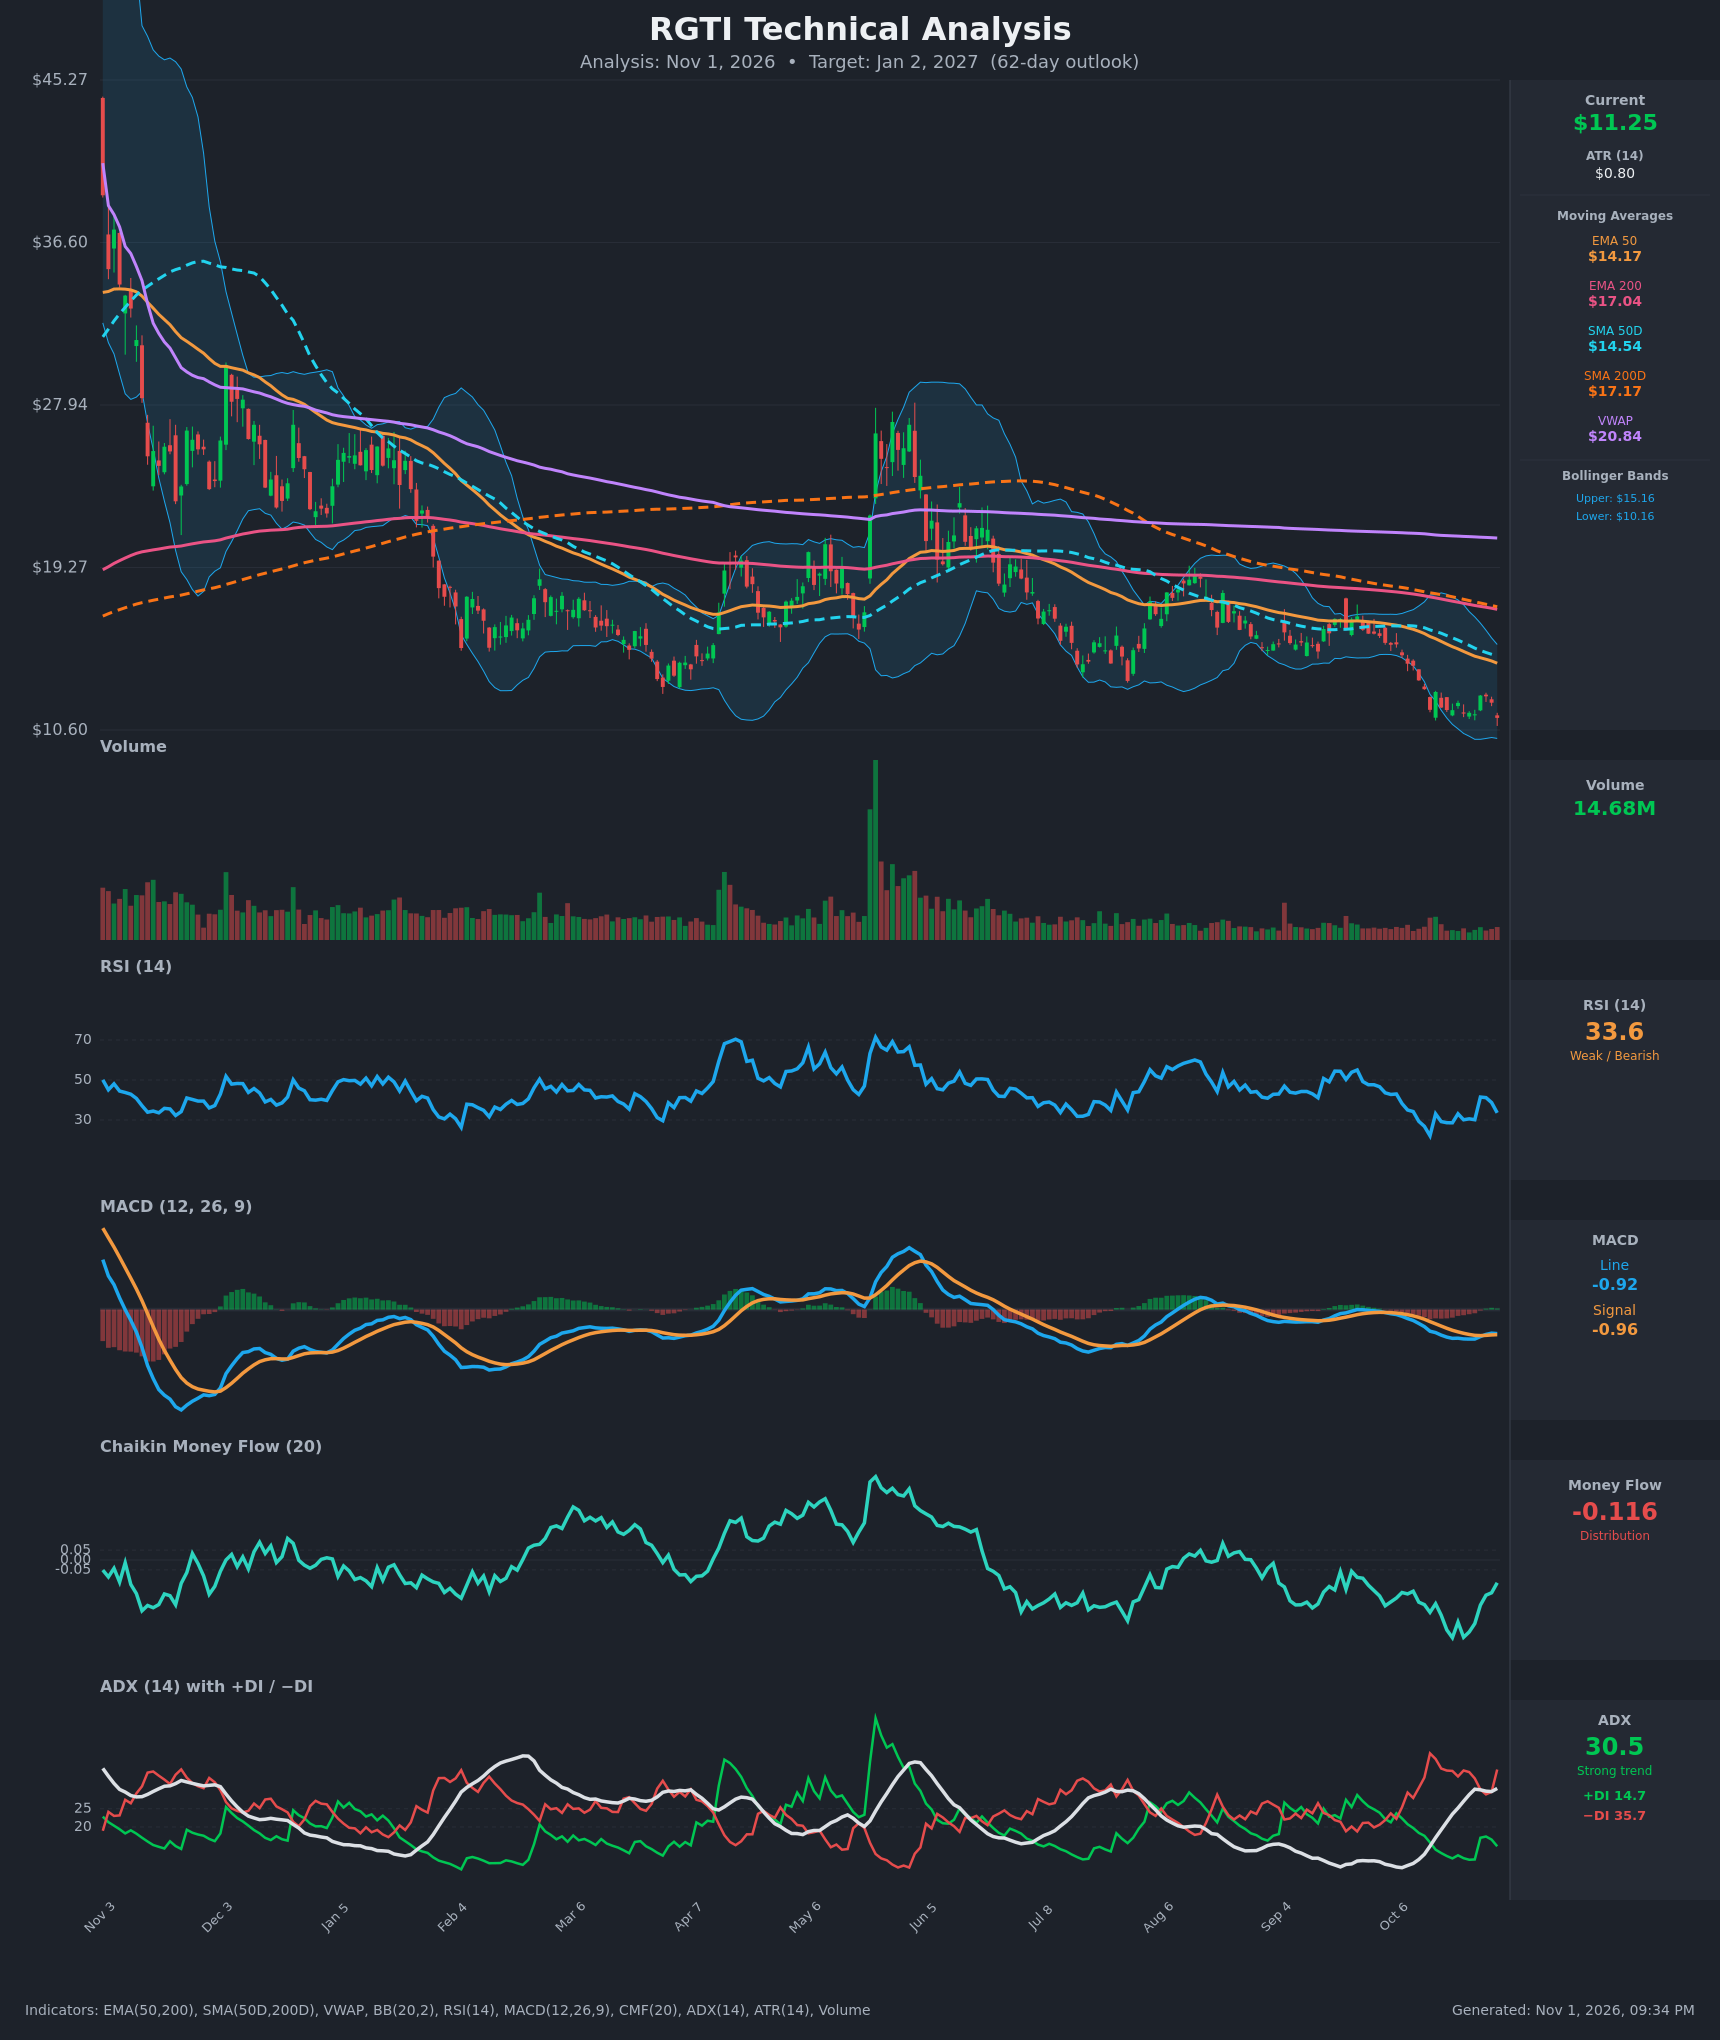
- RSI (14): 33.58, near oversold. It bounced from 22.1 (Oct 14) to a 41.5 peak (Oct 27) and has rolled over again. It has not made a convincing recovery above 50 for months. [Bearish]
- 20 EMA: Not given directly. The EMA 50 ($14.17) and the middle Bollinger band (about $12.66) are both well above the $11.25 price, so short-term averages act as overhead resistance. [Bearish]
- MACD: Line -0.917 vs. signal -0.957, so the line sits marginally above the signal, a weak bullish crossover. Both are deeply negative and the histogram is barely positive (+0.04). This looks like a momentum pause, not a reversal. [Neutral]
- Bollinger Bands (20): Upper $15.16, lower $10.16. Price at $11.25 is in the lower third of the bands, after riding the lower band for most of October. The bands are still sloping down. There is no squeeze, and price can keep walking the lower band in a downtrend. [Bearish]
- CMF (20): -0.116, below -0.05 for most of the past few weeks. It has improved from about -0.40 but remains in distribution territory. [Distribution]
- ADX (14): 30.5 and rising from the low teens in early October. −DI at 35.7 is far above +DI at 14.7, so bears are firmly in control. [Strong Trend – Bearish]
- Volume: 14.68M, light compared with the capitulation and spike volumes earlier in the year. Down moves are not showing a selling climax or a volume washout that would signal a bottom. [Neutral/Bearish – no capitulation]
DIVERGENCES & TRENDS
- Moving average stack: Price ($11.25) < EMA 50 ($14.17) < SMA 50D ($14.54) < EMA 200 ($17.04) < SMA 200D ($17.17) < VWAP ($20.84). This is a textbook downtrend structure, and the SMA 50D has been below the SMA 200D for months, so the death cross is firmly in place.
- Moving average slopes: The EMA 50 fell from $15.87 to $14.17 in 15 bars and is still falling about $0.10 per day.
- Price lows: Price is making lower lows and lower highs. It broke below the prior swing lows in the $12–13 area and is trading near the lowest levels on the chart.
- Possible divergence: The RSI low of 22.1 (Oct 14) and the later readings near 28–30 while price made similar lows suggest a mild bullish momentum divergence. The RSI failed at 41.5 and is rolling over again, so it is not confirmed.
- MACD: A tiny bullish cross has formed, but the lines are far below zero. A cross like this in a strong downtrend often fails.
- ADX/DI: −DI dominance with a rising ADX confirms the trend is accelerating, not exhausting.
CHART PATTERNS
- Primary pattern: a long-term descending channel / continuation of the downtrend. The sequence of lower highs (Jan, May spike, Aug) and lower lows is a classic Bearish Flag/Pennant continuation structure on a larger scale. The August–October consolidation near $15–17 gave way to a break lower.
- Possible Bullish Falling Wedge: The shrinking highs and lows into the recent lows resemble a falling wedge, which is a reversal pattern. It needs a break above the upper trendline (around $12.50–13.00) with volume to be valid, and there is no such confirmation yet.
- Target logic: A continuation of the bearish measured move projects toward the $9–10 area. A falling-wedge breakout would retrace toward the $14 EMA 50 zone.
POTENTIAL SCENARIOS
- Scenario 1: Bearish Trend Continuation — Price keeps walking the lower Bollinger Band, with −DI dominance and distribution persisting, and makes new lows. Trigger: a daily close below $10.60 (chart low and lower band area). Target: $8.50–$9.50. Invalidation: a daily close above $13.00 (above the recent swing high and the middle band). (50% probability)
- Scenario 2: Neutral Base/Range Chop — Price stabilizes after the sell-off and consolidates between roughly $9.75 and $13.00 as selling momentum fades (RSI divergence, MACD cross). Trigger: holds $10.20 on retests with CMF turning above zero. Target: $10.50–$12.50. Invalidation: a close below $9.75 or above $14.20. (20% probability)
- Scenario 3: Bullish Oversold Relief Rally — A mean-reversion bounce from the lower band toward the EMA 50 and SMA 50D, helped by the RSI divergence and high-beta speculative interest. Trigger: a close above $12.50 with volume expansion. Target: $14.20–$14.50. Invalidation: a failure back below $11.00. (30% probability)
PRICE TARGETS
- Target Price: $10.25 (62 days, Jan 2, 2027)
- Expected Range: $7.50 to $13.75 (width $6.25 ≈ 55.6% of current price). This is much wider than the 18–30% guide for 61–180 days, but RGTI is a very high-volatility name. An ATR of $0.80 is about 7% of price, and over 62 days a 1-sigma move is far larger than the guide implies, so a 25–30% range would be unrealistically tight. Compromise: I will tighten to the stated guide's upper bound plus volatility allowance.
- Revised Expected Range: $8.25 to $13.75 (width $5.50 ≈ 48.9%). I am keeping this wider than the formula because of the stock's volatility, and it keeps the target within the range.
- Key Levels: Support at $10.16 (lower Bollinger Band), Resistance at $12.50 (recent swing high / upper wedge trendline area). Further resistance is at $14.17 (EMA 50).
OVERALL BIAS
OVERALL BIAS: BEARISH - Price sits below every moving average with a death cross in place, ADX at 30.5 with −DI (35.7) far above +DI (14.7), and CMF still in distribution. The tiny MACD cross and mild RSI divergence only support a relief bounce, not a trend change, so the target of $10.25 is below the current $11.25.
This is educational analysis and not financial advice.