RGTI 76-day bearish forecast — Nov 1, 2026
- Bias: Bearish
- Timeframe: 76 days (made Nov 1, 2026, target date Jan 15, 2027)
- Price at analysis: $11.25
- Price target: $10.30
- Expected range: $7.70 – $13.70
- Result: Pending — graded after the close on Jan 15, 2027
Get a free AI analysis of RGTI today
Analysis
TECHNICAL INDICATORS
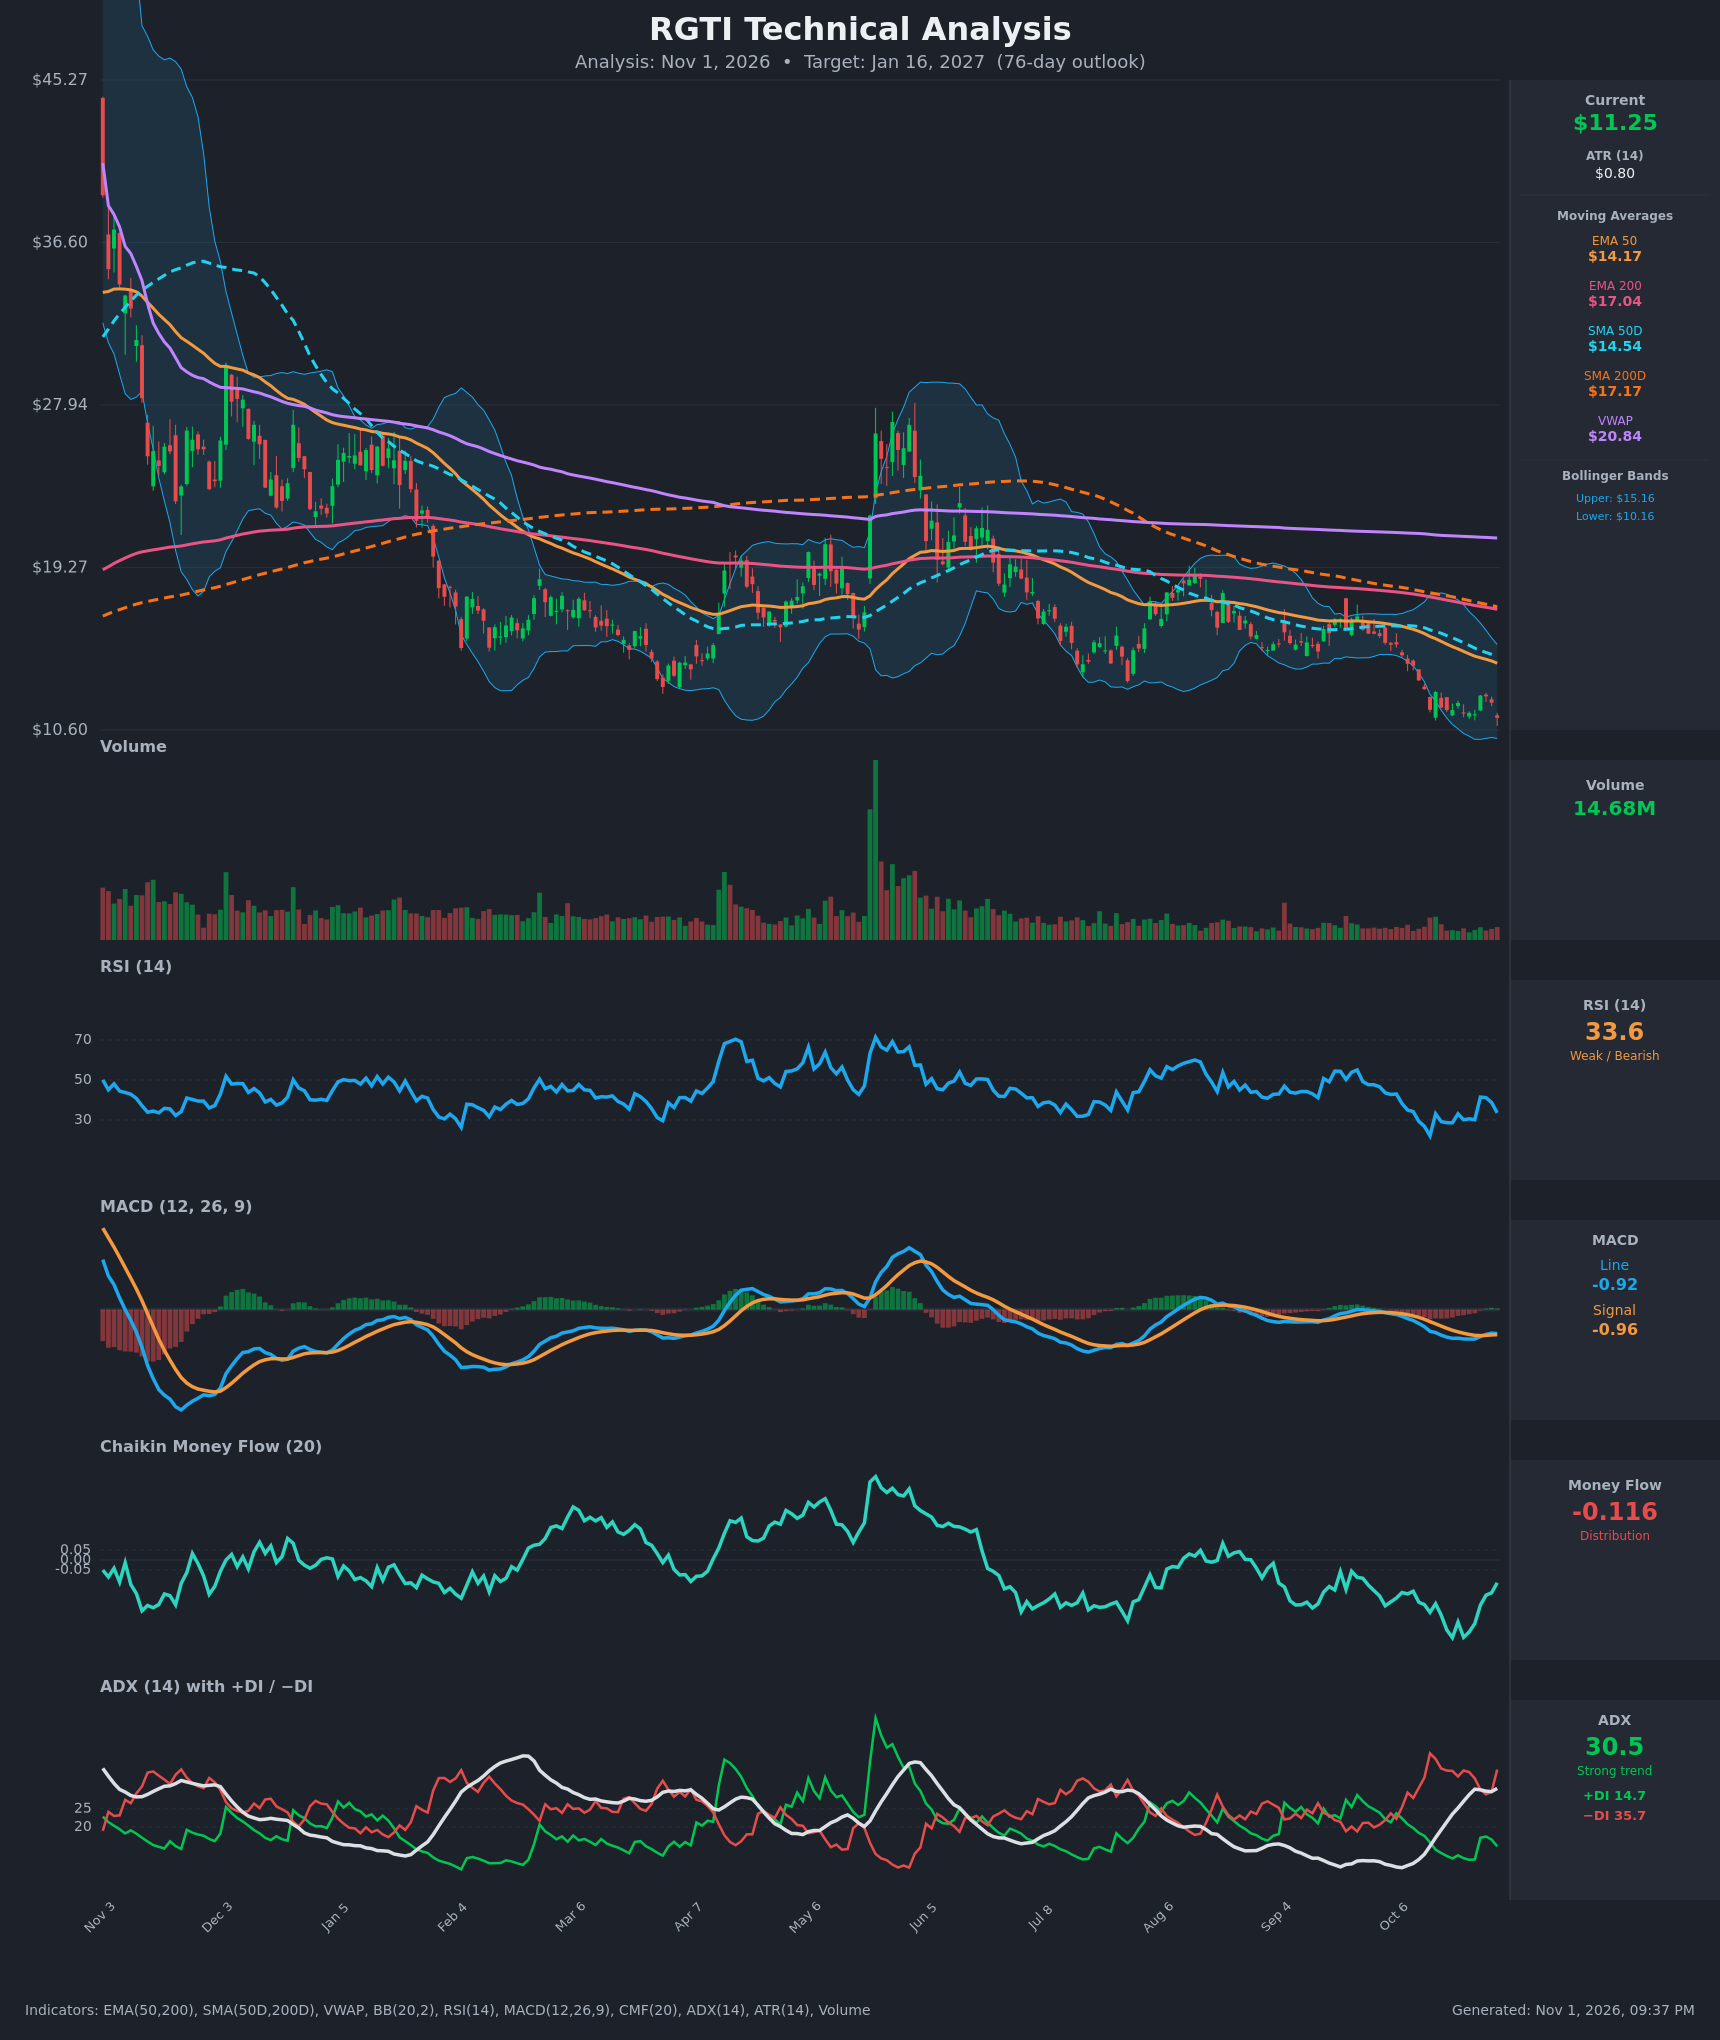
- RSI (14): 33.58, just above oversold. It bounced from 22 on Oct 14 to a high of 41.5 on Oct 27, then rolled over again with the drop to $11.25. It has made no new momentum high, and readings in the 30s are typical of a persistent downtrend. [Bearish]
- 20 EMA: No 20 EMA value was supplied. The EMA 50 is $14.17, about 26% above price, and it has fallen every day in the table (from $15.87). Price has been below it throughout, so it acts as overhead resistance. [Bearish]
- MACD: Line -0.917 is just above the signal at -0.957, after a bullish crossover on about Oct 28. The histogram is slightly positive (+0.04), but both lines are deeply negative and the line has begun to turn down again (-0.900 to -0.917). The crossover is weak and risks failing. [Neutral]
- Bollinger Bands (20): Upper $15.16, lower $10.16, with price at $11.25 in the lower quarter of the band. The mid-band is about $12.66 and price is below it. Price has walked the lower band for weeks, and the chart shows new multi-month lows. This is a downtrend with room to touch the lower band at about $10.16, not a clean mean-reversion setup. [Bearish]
- CMF (20): -0.116, below the -0.05 threshold. It improved from -0.395 on Oct 20 but remains in distribution territory, meaning selling pressure still dominates. [Distribution]
- ADX (14): 30.5 and rising, a strong trend. −DI at 35.7 is far above +DI at 14.7, so bears control the trend. [Strong Trend – Bearish]
- Volume: 14.68M, relatively low compared with the earlier spikes (the May rally and the early-period selling). The decline is on quiet volume, which suggests a grinding drift rather than capitulation. There are no signs of a volume-backed reversal. [Neutral/Bearish]
DIVERGENCES & TRENDS
- Moving averages: The EMA 50 ($14.17) is below the EMA 200 ($17.04), and the SMA 50D ($14.54) is below the SMA 200D ($17.17). Both are death-cross configurations, and the gaps are not closing. Price is below all of them and below VWAP ($20.84), which signals persistent seller control.
- Lower highs: The chart shows a sequence of lower highs since the early spike above $40, with a rally to about $27 in May that failed and was fully retraced.
- Divergences: There is a mild short-term RSI/MACD improvement versus the Oct 14 low (RSI 22 to 29-30 on later lows). This is a minor bullish divergence in momentum, but price has not confirmed it with a higher high, and the Oct 27 bounce to $12.44 was sold into.
- Trend direction: ADX has climbed from 11 to 30 over the period, which confirms trend strength building to the downside. CMF is improving slightly but remains negative.
- Crossovers: The MACD bullish crossover is marginal and already fading. There is no DI crossover, and −DI is still dominant.
CHART PATTERNS
- Primary pattern: A long-running descending channel with lower highs and lower lows, with price at the bottom of the Bollinger Band. The closest reference patterns are a Bearish Pennant/Flag continuation in the larger downtrend and a Descending Triangle (the roughly $11.4–$11.7 area acted as a repeated support shelf). A decisive close below that shelf would be a bearish breakdown.
- Targets: A measured move below the $11.4 shelf, using the ATR-based range and the lower Bollinger Band, points to the $9.50–$10.20 area. Potential bullish reversal patterns (Double Bottom / Falling Wedge) are not confirmed, as there is no breakout above $12.45–$12.60.
POTENTIAL SCENARIOS
- Scenario 1: Bearish Trend Continuation — Price breaks the $11.40 shelf and grinds lower, with −DI dominant, ADX above 25 and the death-cross structure intact. Trigger: Daily close below $11.40 and the $10.16 lower band. Target: $9.00–$10.00. Invalidation: Close above $12.65 (the mid-band) with RSI above 45. (50% probability)
- Scenario 2: Neutral Base-Building Range — Price stabilizes after the oversold readings, with CMF improving and MACD flattening. It chops between support and the declining EMA 50. Trigger: Holds $10.20–$11.00 on lower volume. Target: $10.50–$13.00. Invalidation: Daily close below $10.00 or above $14.20. (28% probability)
- Scenario 3: Bullish Relief Rally / Reversal — An oversold bounce driven by a MACD crossover, RSI divergence and improving CMF, targeting the EMA 50 and SMA 50D. Trigger: Close above $12.65, then $12.95. Target: $14.20–$14.50. Invalidation: Close back below $11.00. (22% probability)
PRICE TARGETS
- Target Price: $10.30 (76 days)
- Expected Range: $7.70 to $13.70 (width $6.00, ≈53% of the current price, wider than the 18–30% guideline because RGTI is highly volatile, with an ATR of about 7% of price; the downside is capped by the lower Bollinger Band support area, while upside is limited by the EMA 50 at $14.17)
- Key Levels: Support at $10.16, Resistance at $12.65
Self-check: Width = $13.70 − $7.70 = $6.00, or 53% of $11.25. This is wider than the standard 61–180 day guidance of 18–30%, which I chose deliberately given ATR and the stock's historical swings (for example the 2x rally in May). The width is more than 2-3x any shorter-term range, and the target is below the current price, consistent with a bearish bias.
OVERALL BIAS
OVERALL BIAS: BEARISH - Price is below all key moving averages and VWAP in a death-cross structure, with −DI (35.7) far above +DI (14.7), ADX at 30.5 and rising, CMF in distribution and price hugging the lower Bollinger Band. The MACD crossover is weak and unconfirmed, so a relief bounce is possible but the path of least resistance remains lower.
This is educational analysis and not financial advice.