RGTI 97-day bearish forecast — Nov 1, 2026
- Bias: Bearish
- Timeframe: 97 days (made Nov 1, 2026, target date Feb 5, 2027)
- Price at analysis: $11.25
- Price target: $9.90
- Expected range: $8.30 – $11.50
- Result: Pending — graded after the close on Feb 5, 2027
Get a free AI analysis of RGTI today
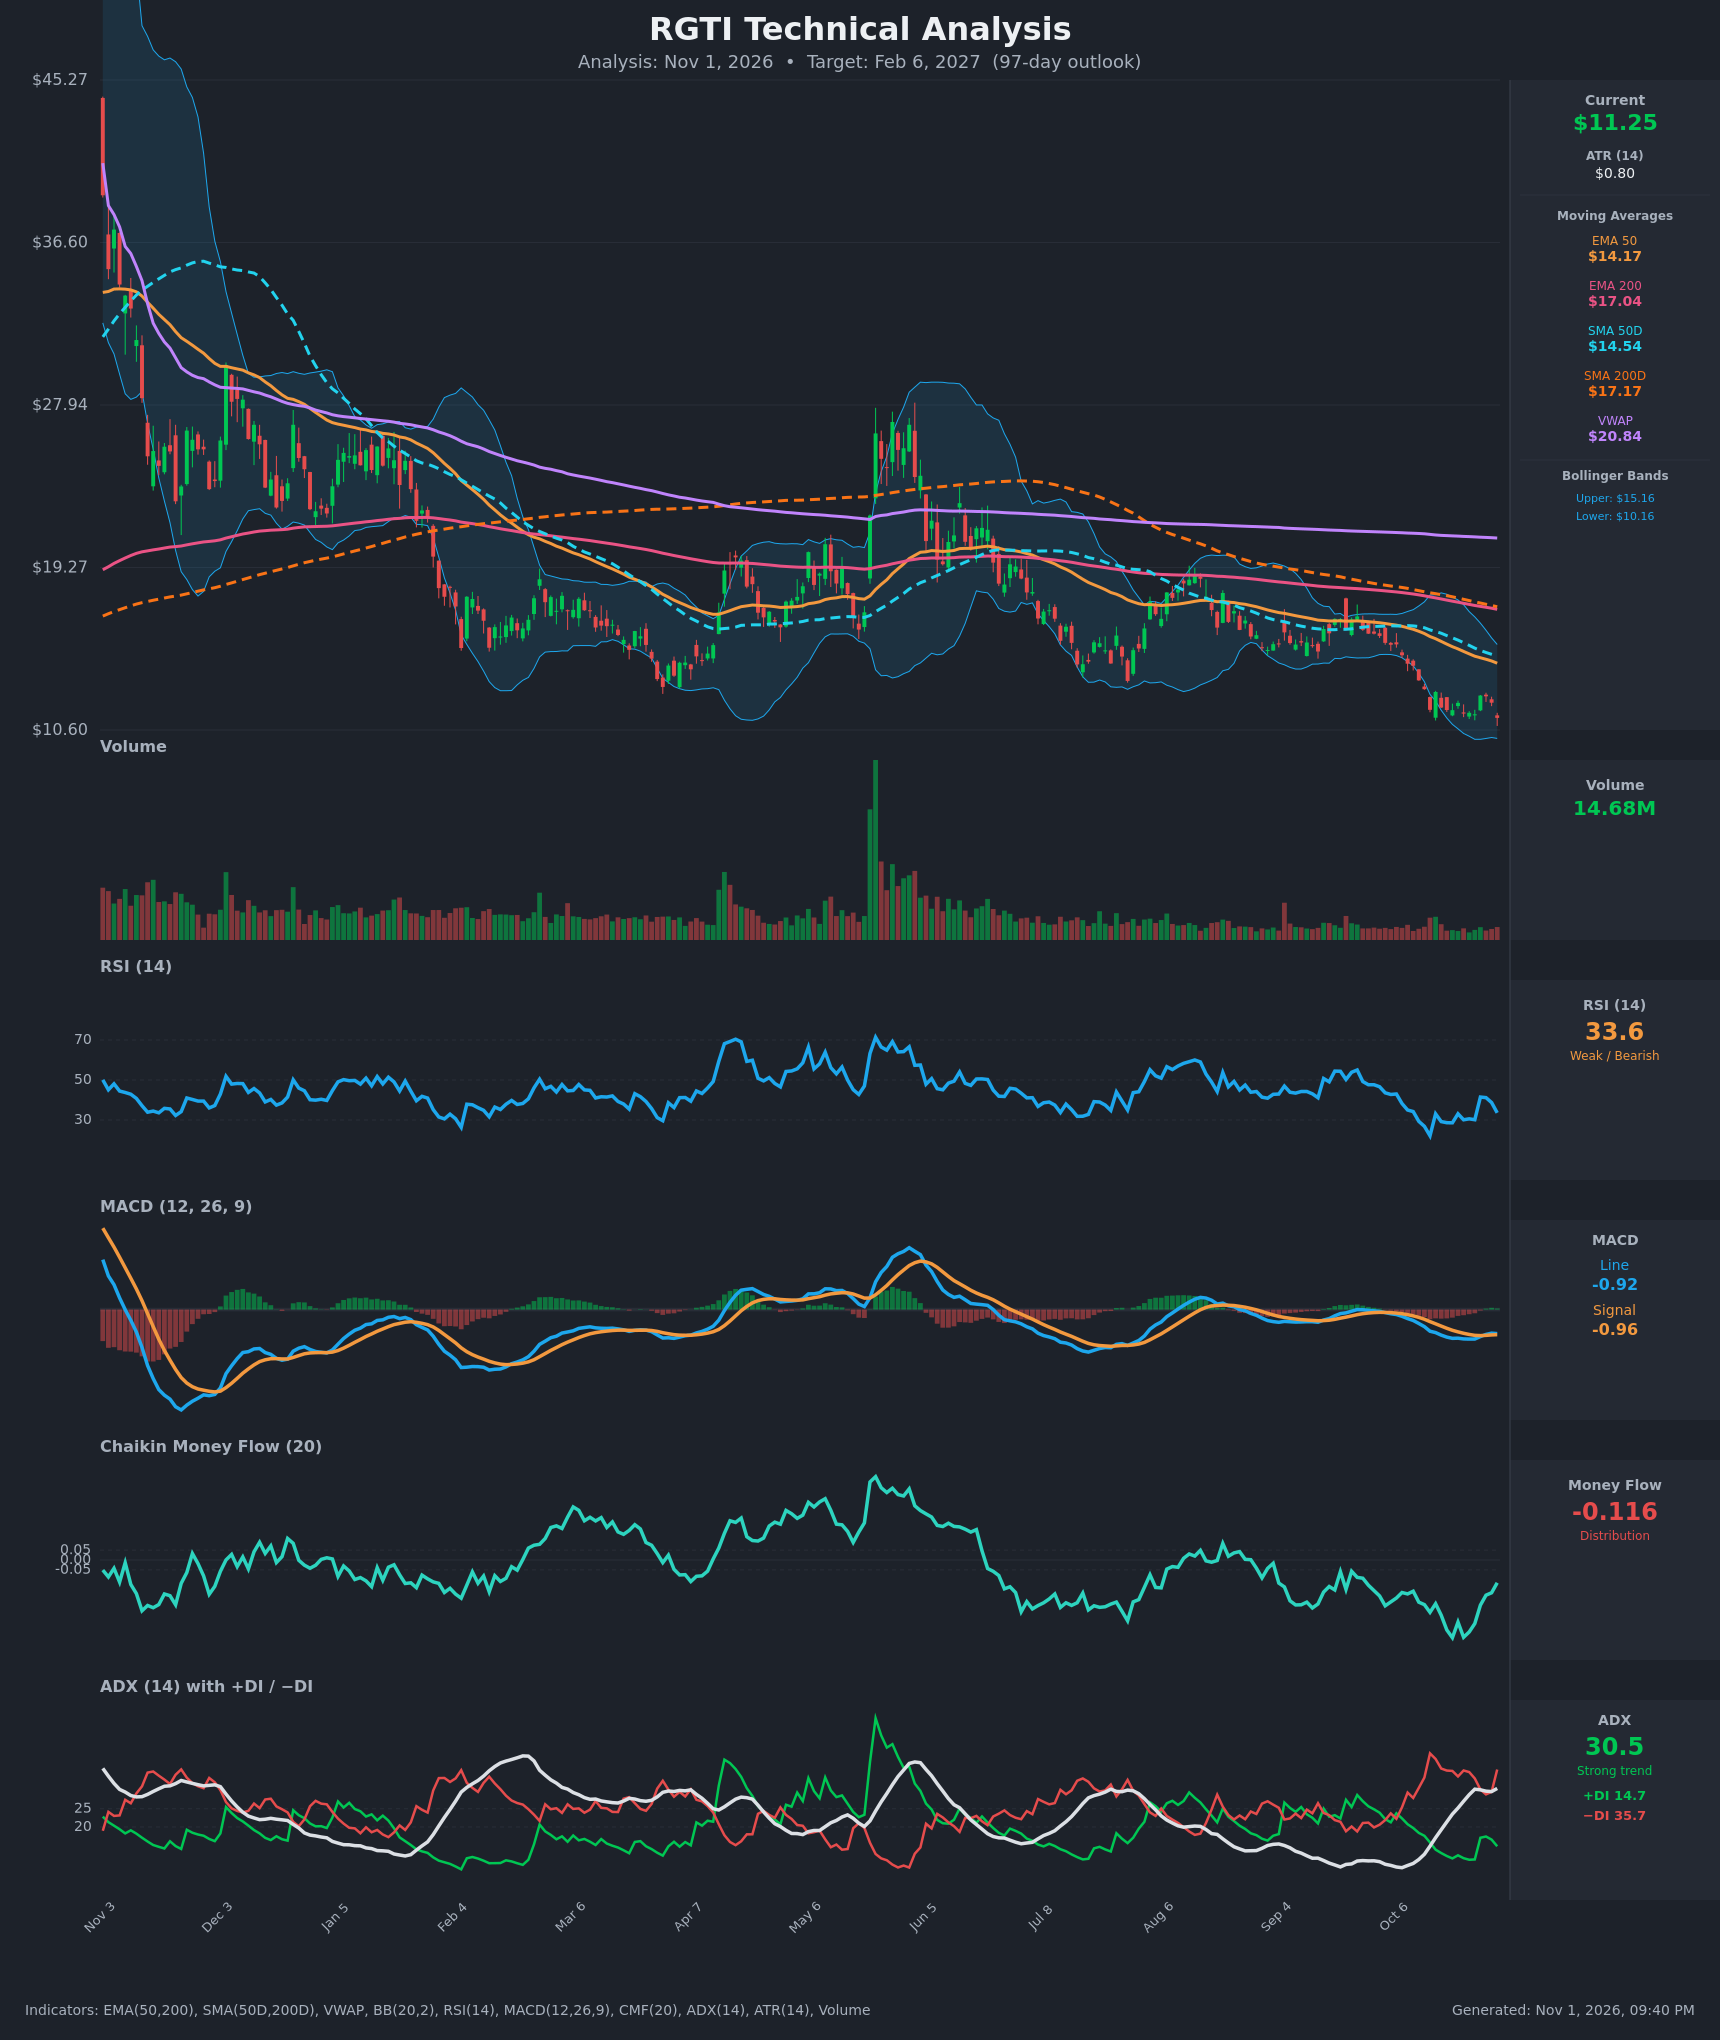
Analysis
TECHNICAL INDICATORS
- RSI (14): 33.58, just above the oversold line and bouncing between 22 and 41 over the past two weeks. It sits well below 50, so momentum is weak, though RSI is not making new lows with price. [Bearish]
- 20 EMA: No 20 EMA value was supplied, so I use the EMA 50 at $14.17 and EMA 200 at $17.04. Price at $11.25 is about 20% below the EMA 50, and both EMAs are still falling, with the EMA 50 below the EMA 200. Both act as overhead resistance. [Bearish]
- MACD: Line -0.917 is slightly above signal -0.957, so the histogram is marginally positive (about +0.04). This is a shallow bullish crossover from Oct 27-28, but both lines are deep below zero and the line has begun to roll over again. It is a weak relief signal inside a downtrend. [Neutral]
- Bollinger Bands (20): Upper $15.16, lower $10.16, so the midline is about $12.66. Price is in the lower third of the bands, and the bands are narrowing after the October flush. Price walked the lower band earlier in the month, which is typical of a downtrend. [Bearish]
- CMF (20): -0.116, below the -0.05 distribution threshold. It has recovered from -0.395 on Oct 20 but remains negative, so selling pressure is easing but not yet reversed. [Distribution]
- ADX (14): 30.5 and rising from 11 two weeks ago, so a strong trend is established. −DI at 35.7 is far above +DI at 14.7, and the Oct 30 drop widened the gap again. [Strong Trend – Bearish]
- Volume: 14.68M, low relative to the spike seen around May and the heavy volume of the November-December decline. Volume has faded steadily, so the selling is orderly rather than capitulative, and no volume surge confirms a bottom. [Neutral to Bearish – no capitulation]
DIVERGENCES & TRENDS
- Long-term structure: Price is below the SMA 200 ($17.17), EMA 200 ($17.04), SMA 50 ($14.54), EMA 50 ($14.17) and VWAP ($20.84). The SMA 50 is already below the SMA 200 (death cross in place), and the EMA 50 is below the EMA 200. The long-term trend is firmly down, with lower highs and lower lows since the November peak.
- Mild bullish divergence: Price made a new low at $11.25 below the Oct 14 close of $11.68, while RSI is at 33.6 versus 22.1 then. CMF has also improved from -0.395 to -0.116. This points to fading downside momentum and a possible relief bounce.
- MACD: It is basically flat around -0.9 to -1.1 and has produced only a marginal bullish crossover. The late-October bounce to $12.44 failed immediately, and the Oct 30 drop erased much of it.
- ADX/DI: −DI has stayed above +DI since the October breakdown. +DI briefly rose to 17 on the bounce but was rejected, which confirms bearish control.
- Rejection: Price failed at the $12.40-12.45 area on Oct 27-28, which is now short-term resistance.
CHART PATTERNS
- Primary read: A persistent descending structure of lower highs and lower lows, closest to the Descending Triangle / bearish continuation family on the reference diagram. Price keeps breaking support ($11.4-11.7) and rejecting at lower highs.
- Alternative read: The compression since August could be read as a Bullish Falling Wedge, a reversal pattern. It is not confirmed, because there has been no breakout above the upper trendline (roughly $12.5-13.5) and no volume expansion.
- Targets: A continuation measured move from the recent consolidation points to roughly $9.50-10.00. A falling wedge breakout would target a retest of the EMA 50 / SMA 50 at about $14.2-14.5.
POTENTIAL SCENARIOS
- Scenario 1: Bearish Trend Continuation — The strong ADX, −DI dominance, negative CMF and the death cross keep sellers in control, and rallies fade at declining moving averages. Trigger: daily close below $10.60-10.16 (recent low and lower Bollinger Band), or another rejection at $12.45. Target: $9.00-10.00, with an extension to about $8.50. Invalidation: daily close above $12.70 (BB midline) followed by a push above $14.20 (EMA 50). (50% probability)
- Scenario 2: Bullish Relief Rally / Falling Wedge Breakout — The RSI and CMF divergences and a positive MACD crossover allow a mean-reversion bounce. Trigger: break above $12.45 with rising volume and CMF back above 0. Target: $13.50-14.50, the EMA 50 / SMA 50 zone. Invalidation: loss of $10.16. (32% probability)
- Scenario 3: Neutral Basing Range — Price chops between roughly $10.20 and $12.50 as selling exhausts on declining volume. Trigger: ADX rolling over below 25 and repeated defence of $10.60. Target: $10.50-12.00. Invalidation: a close outside the $10.16-12.70 range. (18% probability)
PRICE TARGETS
For the 97-day horizon (Feb 6, 2027):
- Target Price: $9.90
- Expected Range: $8.30 to $11.50 (width $3.20, about 28% of the current price, consistent with the 61-180 day guidance)
- Key Levels: Support at $10.16, Resistance at $12.45
OVERALL BIAS
OVERALL BIAS: BEARISH - Price is below every major moving average and VWAP, with ADX at 30.5 and −DI far above +DI, CMF in distribution and a death cross in place. The mild RSI/CMF divergences and the marginal MACD crossover argue for bounces, but the evidence favours further downside with modest conviction.
This is educational analysis and not financial advice.