SNDK 22-day bearish forecast — Nov 2, 2026
- Bias: Bearish
- Timeframe: 22 days (made Nov 2, 2026, target date Nov 24, 2026)
- Price at analysis: $1132.68
- Price target: $1070.00
- Expected range: $1000.00 – $1160.00
- Result: Pending — graded after the close on Nov 24, 2026
Get a free AI analysis of SNDK today
Analysis
TECHNICAL INDICATORS
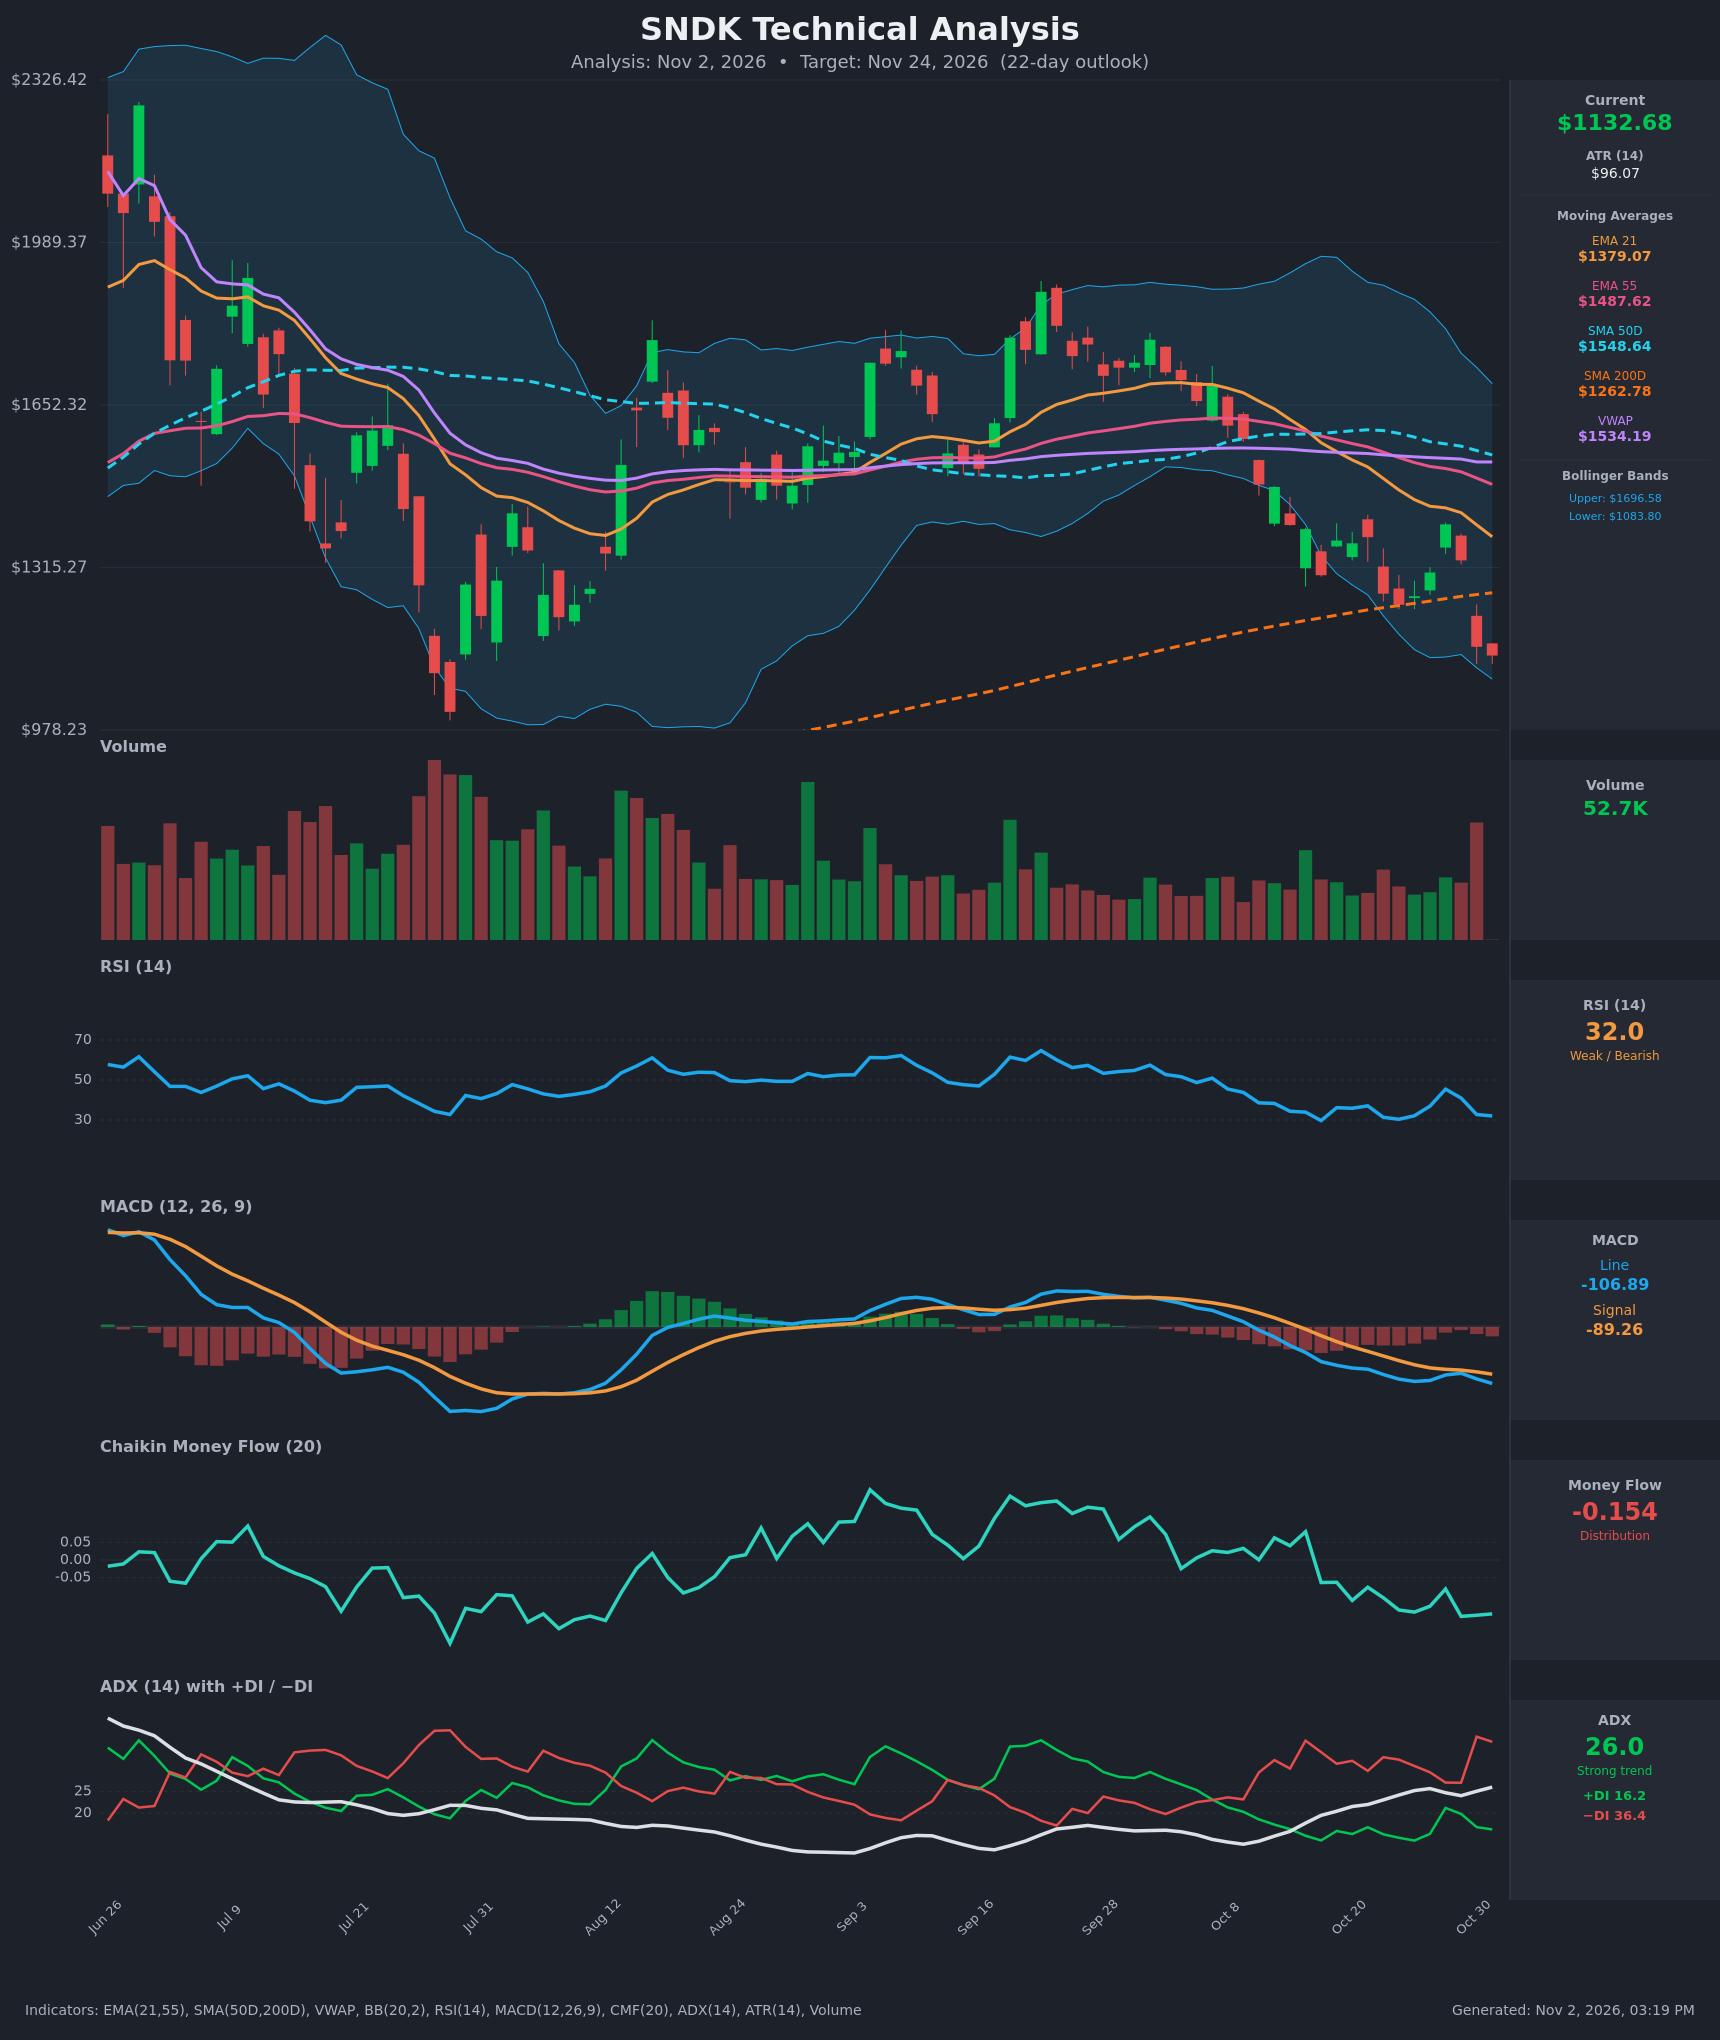
- RSI (14): 32.0, just above oversold (<30) after bottoming at 29.7 on Oct 16. A bounce to 45 on Oct 28 failed, and RSI has turned back down from lower highs. Momentum is weak with no bullish divergence yet. [Bearish]
- 20 EMA (EMA 21): $1379.07, with price about 18% below it. The EMA is falling steeply and acts as overhead resistance. EMA21 crossed below EMA55 ($1487.62) around Oct 16, a bearish crossover. [Bearish]
- MACD: Line -106.89 is below signal -89.26 and both are below zero. The bearish crossover came on Oct 15 and the gap is widening again (histogram about -17.6, expanding). There was only a brief stall on Oct 27-28. [Bearish]
- Bollinger Bands (20): Upper $1696.58, lower $1083.80, with price at $1132.68 in the lower quarter of the bands. The bands are wide, so volatility is elevated. A walk along the lower band after a sharp break is typical of a trend down. Price is oversold but has not yet closed below the lower band. [Bearish]
- CMF (20): -0.154, below the -0.05 threshold and sustained negative since about Oct 16 (the only exception was a brief rebound near -0.08). Capital is leaving the stock. [Distribution]
- ADX (14): 26.0 and rising from 14.7 on Oct 13. −DI (36.4) is far above +DI (16.2), with the −DI spike on Oct 30 coming from the sharp drop. This is a strong, developing downtrend. [Strong Trend – Bearish]
- Volume: 52.7K, with a heavy red bar on the latest sessions' breakdown (Oct 30). Volume is expanding on down moves and contracting on bounces, which is the pattern of a trend that is still in distribution. [Bearish]
Other averages:
- SMA50D is $1548.64 and VWAP is $1534.19. Price is far below both, which is a sign of sellers in control.
- SMA200D is $1262.78 and rising. Price has broken below it, which turns the long-term trend into a warning. There is no death cross yet (SMA50D is above SMA200D), but the gap is narrowing.
DIVERGENCES & TRENDS
- There is no bullish RSI divergence. RSI made a low of 29.7 at a price of $1299, and now sits at 32 at a lower price of $1132. That is a mildly bearish sequence of lower lows in price with RSI at similar levels. It is not a bullish divergence.
- MACD, ADX and CMF all confirm the lower price. The trend indicators are making new extremes along with price, which is healthy for the trend, not a sign of exhaustion.
- The bullish MACD cross was last seen in August, and the bearish cross came on Oct 15.
- Price lost the SMA200D ($1262.78) on Oct 30 with a ~13% single-day drop from $1330 to $1151, which looks like a breakdown or capitulation-style bar. Moves this large can lead to short-term oversold bounces, but those tend to be sold at the broken support.
- The EMA21/EMA55 bearish cross and the SMA50D rolling over reinforce a downtrend.
CHART PATTERNS
- Breakdown from a broad consolidation (Bearish Head and Shoulders / lower-high structure): From Aug to Oct, price traded between roughly $1450 and $1850, then failed to hold the lower part of that range. Each rally since late September has made lower highs ($1850, $1700, $1500, $1405). This resembles the bearish reversal patterns in the diagram (Head and Shoulders / Triple Top type), where the neckline is the range floor at about $1300-$1400. That has already broken.
- Bearish Flag/Descending channel: The consolidation at $1240-$1405 between Oct 22 and Oct 29 behaves like a small bearish flag, and the Oct 30 drop was the flag breakdown. The measured move from the flag (pole of roughly $1700 to $1300 = $400) points to well below the current price, but a 22-day target should be tempered by the oversold readings.
- Targets: Pattern targets suggest $1000-$1085 first (lower Bollinger Band and the prior swing lows near $978-$1000 on the chart axis).
POTENTIAL SCENARIOS
- Scenario 1: Bearish Trend Continuation — Price is below every moving average, with −DI dominant, ADX rising and CMF negative. Sellers push the stock down to the lower Bollinger Band and then toward the ~$1000 zone. Trigger: a close below $1083.80 (lower BB) on expanding volume. Target: $1000-$1070. Invalidation: a daily close above $1262.78 (SMA200D). (55% probability)
- Scenario 2: Bullish Oversold Relief Bounce — RSI near 30 with price at the lower band can bring a short-covering bounce, similar to the Oct 27-28 rally (+8% in one day). Trigger: a close above $1260 with RSI back above 45. Target: $1260-$1380 (SMA200D, then EMA21). Invalidation: a failure at $1260 and a break back below $1130. (30% probability)
- Scenario 3: Neutral Base Building — Price stabilizes between roughly $1050 and $1200 as selling exhausts, with declining volume and ADX flattening. Trigger: several closes between $1083 and $1200. Target: $1100-$1150. Invalidation: a close outside $1050-$1250. (15% probability)
PRICE TARGETS
For the 22-day timeframe (in the range between the 14-21 day and 30-60 day guidance bands):
- Target Price: $1070.00
- Expected Range: $1000.00 to $1160.00 (width $160 = about 14.1% of the current price)
- Key Levels: Support at $1083.80 (lower Bollinger Band; the next support is about $1000), Resistance at $1262.78 (SMA200D, now acting as resistance)
Self-check: the range width is about 14.1%, which is consistent with a 22-day timeframe and well wider than any 2-3 day or 14-day range.
OVERALL BIAS
OVERALL BIAS: BEARISH - Price is below the EMA21, EMA55, SMA50D, SMA200D and VWAP. MACD is in a bearish crossover and widening, ADX of 26 is rising with −DI (36.4) far above +DI (16.2), and CMF is clearly negative at -0.154. An oversold bounce is possible (RSI 32, near the lower band), but rallies should meet resistance at the SMA200D near $1263.
This is educational analysis and not financial advice.